

User engagement is defined as the measurable interactions a person has with your content or platform that signal genuine interest and intent. Understanding why track user engagement matters is the difference between growing an audience and simply accumulating one. Companies using structured engagement analytics experience 41% faster revenue growth and 51% higher retention. That gap is not a rounding error. It reflects what happens when you stop guessing and start reading real behavioral signals.
Why track user engagement: the core business case
Engagement metrics are leading indicators, not lagging ones. They tell you what users are likely to do next, not what they already did. Engagement describes behavior that forecasts future outcomes rather than reflecting past results. A spike in saves and shares on a post predicts audience growth before your follower count moves. A drop in feature adoption predicts churn before a cancellation happens.
The importance of user engagement becomes clearest when you connect it to revenue. Retention is cheaper than acquisition, and engagement data is your earliest warning system for retention risk. When a user stops clicking, stops returning, or stops completing key actions, that pattern appears in your metrics weeks before they leave. Tracking it gives you time to respond.

Most digital marketers and small business owners focus on the wrong signals. Total impressions and follower counts feel meaningful because they are large numbers. They are not predictive. Only 3% of companies currently qualify as customer-obsessed by 2026 benchmarks. The other 97% are making decisions on data that does not connect to outcomes.
What are the key engagement metrics to track in 2026?
The shift in 2026 is from surface metrics to outcome metrics. Surface metrics include likes, pageviews, and total impressions. Outcome metrics include task completion, scroll depth, return visitor rate, and time to first value. Surface metrics like logins and clicks can mislead; outcome metrics predict whether users will stay.
Engagement rate by reach
Engagement rate by reach is the industry standard calculation: (Total Engagements / Unique Reach) × 100. It is more accurate than measuring against follower count because it reflects who actually saw your content. A good engagement rate falls between 1% and 5% depending on platform and industry. Instagram and LinkedIn sit at the higher end of that range, around 3.5%.
Platform-weighted interactions
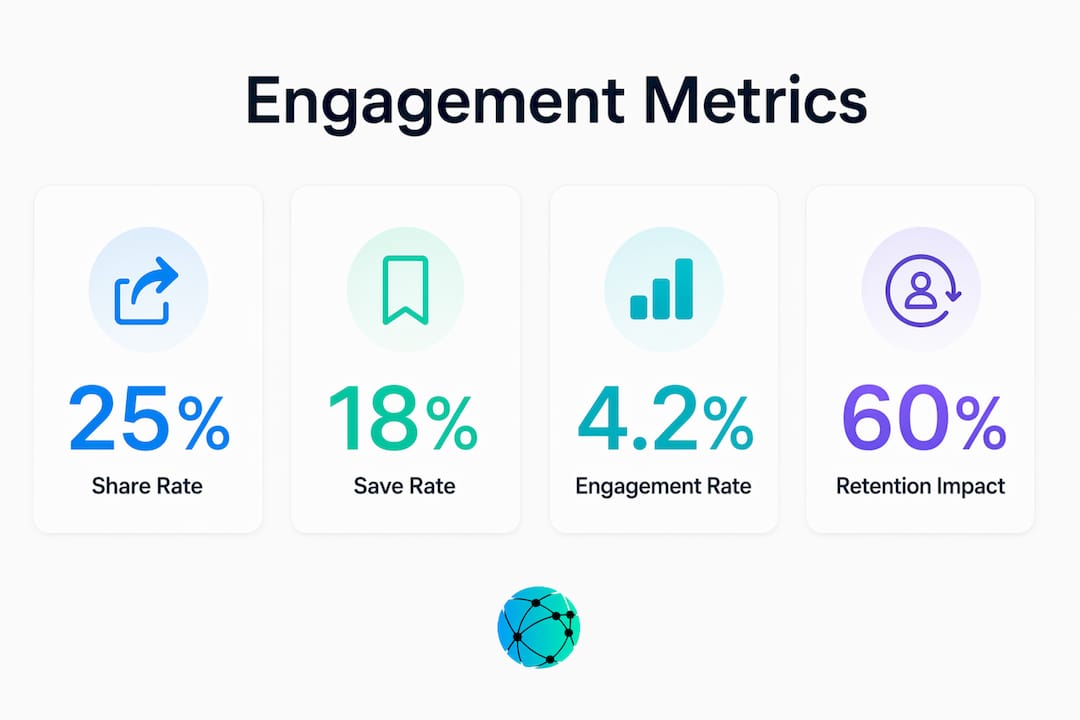
Not all interactions carry equal weight in platform algorithms. Modern algorithms prioritize shares and saves, weighting them approximately 5 times higher than likes. A post with 20 shares outperforms one with 100 likes in organic distribution. Tracking saves and shares separately from likes gives you a cleaner picture of content quality.
Composite engagement scores
A composite engagement score blends frequency, depth, breadth, and sentiment into one number. A sample weighting looks like this: 40% frequency, 30% depth, 20% breadth, and 10% sentiment. This approach aligns teams on a shared definition of engagement and makes trend detection more reliable than watching a single metric.
Pro Tip: Track engagement velocity, the speed at which interactions accumulate in the first hour after publishing. Early engagement spikes drive algorithmic distribution far more than total monthly engagement. Post when your audience is most active and monitor that first-hour window closely.
| Metric | What it measures | Strength | Limitation |
|---|---|---|---|
| Engagement rate by reach | Interactions per unique viewer | Accurate signal of content resonance | Requires reach data, not just impressions |
| Saves and shares | High-intent interactions | Weighted heavily by algorithms | Lower volume than likes |
| Scroll depth | How far users read | Reveals content quality | Needs web analytics setup |
| Return visitor rate | Repeat audience behavior | Strong retention signal | Lags behind real-time changes |
| Task completion rate | Users finishing key actions | Directly tied to outcomes | Requires event tracking |
Why vanity metrics mislead your engagement strategy
Goodhart's Law states that when a measure becomes a target, it ceases to be a good measure. Turning surface engagement metrics into goals distorts behavior and produces numbers that look good but mean nothing. A team chasing likes will write content optimized for likes, not for conversions or retention.
High engagement that does not correlate with business outcomes is noise. A viral post that drives zero sales, zero sign-ups, and zero return visits did not help your business. The metric looked great. The outcome was empty.
Common vanity metrics to stop treating as goals:
- Follower count. It measures audience size, not audience quality or intent.
- Total impressions. A user can see your content and scroll past it in under a second.
- Email open rates. Apple's Mail Privacy Protection has made open rates unreliable since 2021.
- Total pageviews. A page with high views and zero conversions is a traffic problem, not a success.
- Likes. They require one tap and signal almost nothing about purchase intent.
Red flags that your metrics are misleading you:
- Engagement is rising but conversions are flat or falling.
- Your top-performing content by likes drives no return visits.
- You cannot connect any engagement metric to a specific revenue outcome.
Pro Tip: Always link your engagement metrics to a conversion path. Ask: if this metric improves by 20%, which business outcome changes? If you cannot answer that, the metric does not belong in your reporting dashboard. Learn more about social profile optimization to align your metrics with real results.
One more issue that distorts engagement data in 2026: AI agents. Half of engagement signals in many SaaS dashboards now come from AI agents, not human users. Bots crawling your content, AI tools accessing your links, and automated workflows all generate activity that looks like engagement. Separating human signals from agent signals is no longer optional. It is a measurement requirement.
How to analyze engagement data for better decisions
Analyzing engagement data well requires a lifecycle lens. A new user and a six-month subscriber need different metrics. Onboarding metrics focus on time to first value and feature adoption. Expansion metrics focus on frequency, depth, and cross-channel behavior.
A step-by-step engagement analysis framework:
- Set a baseline. Before making any content or product changes, document your current engagement rate by reach, return visitor rate, and task completion rate. You cannot measure improvement without a starting point.
- Segment by behavior. Group users by engagement pattern: highly active, occasionally active, and dormant. Each segment needs a different response.
- Map metrics to objectives. Each engagement metric should connect to a specific marketing or business objective. Scroll depth maps to content quality. Return visitor rate maps to retention. Shares map to organic reach growth.
- Identify drop-off points. Find where users disengage. A high entry rate with low scroll depth means your hook works but your content does not deliver. A high scroll depth with low CTR means your call to action needs work.
- Test one variable at a time. Change one element, measure the effect on your target metric, and document the result before moving to the next change.
- Review on a fixed cadence. Weekly reviews catch fast-moving trends. Monthly reviews reveal patterns. Both are necessary.
For example: if your link in bio page shows high click volume on your top link but near-zero clicks on everything below it, your layout is burying content your audience might want. Reorganizing by engagement data, not by assumption, fixes that. Platforms like Lflow provide real-time analytics that make this kind of analysis fast and practical.
Practical strategies to improve engagement based on tracking data
Tracking engagement without acting on it is a wasted effort. The data tells you where to focus. These strategies turn that data into growth.
- Create content that earns saves and shares. Saves signal that users want to return to your content. Shares signal that users trust it enough to put their name on it. Both require content that solves a specific problem or delivers a specific insight.
- Optimize your hook for the first three seconds. On social feeds, early engagement velocity determines distribution. A weak opening kills reach before most of your audience sees the post.
- Use scroll depth data to cut or improve weak sections. If users consistently drop off at the same point in a long post or page, that section is losing them. Rewrite it or remove it.
- Segment your follow-up messages. Users who clicked a link but did not convert need a different message than users who never clicked at all. Segmentation based on engagement behavior makes follow-ups relevant instead of generic.
- Audit your lowest-CTR pages monthly. High-traffic pages with low click-through rates are leaving growth on the table. Check the call to action, the page layout, and the match between the content and the audience's intent.
Pro Tip: Use link management tools to track which specific links your audience clicks most. That data tells you what your audience actually wants, not what you think they want.
Consistent messaging across channels also matters. A user who sees your Instagram post, clicks your link in bio, and lands on a page that feels disconnected from the original content will leave. Unified engagement data from multiple channels helps you identify and close those gaps.
Key Takeaways
Tracking user engagement is only valuable when the metrics you choose connect directly to business outcomes like retention, conversions, and revenue growth.
| Point | Details |
|---|---|
| Engagement predicts outcomes | Engagement metrics are leading indicators that forecast retention and revenue before results appear. |
| Outcome metrics beat surface metrics | Track task completion, scroll depth, and return visitor rate instead of likes and impressions. |
| Vanity metrics distort strategy | Goodhart's Law shows that chasing surface metrics produces numbers that look good but drive nothing. |
| Separate human from AI signals | AI agents generate fake engagement data; filtering them out is required for accurate analysis in 2026. |
| Act on the data | Segment users by behavior, map metrics to objectives, and audit low-performing content on a fixed schedule. |
Engagement tracking is a diagnostic tool, not a scoreboard
Most teams I have worked with treat engagement as a scoreboard. They celebrate high numbers and panic at low ones. That framing is the problem. Engagement is a diagnostic tool. It tells you what is working, what is broken, and where your audience's attention actually goes.
The teams that grow fastest are not the ones with the best numbers. They are the ones who ask the best questions of their data. Why did this post earn 40 saves but no shares? Why did this page get 2,000 visits but zero sign-ups? Those questions lead to decisions. Decisions lead to growth.
The AI agent problem is also real and underappreciated. If half your engagement signals come from bots and automated tools, your entire content strategy is built on a distorted picture. Cleaning your data is not a technical task. It is a strategic one.
For small business owners and solo creators especially, the temptation to track everything is strong. Resist it. Pick five metrics that connect to your actual goals, build a baseline, and review them weekly. Simplicity in measurement beats complexity every time. The goal is not a perfect dashboard. The goal is better decisions, faster.
— Axion
Lflow's free analytics for creators and small businesses
Knowing why to track user engagement is only half the work. Having the right tool to do it is the other half.
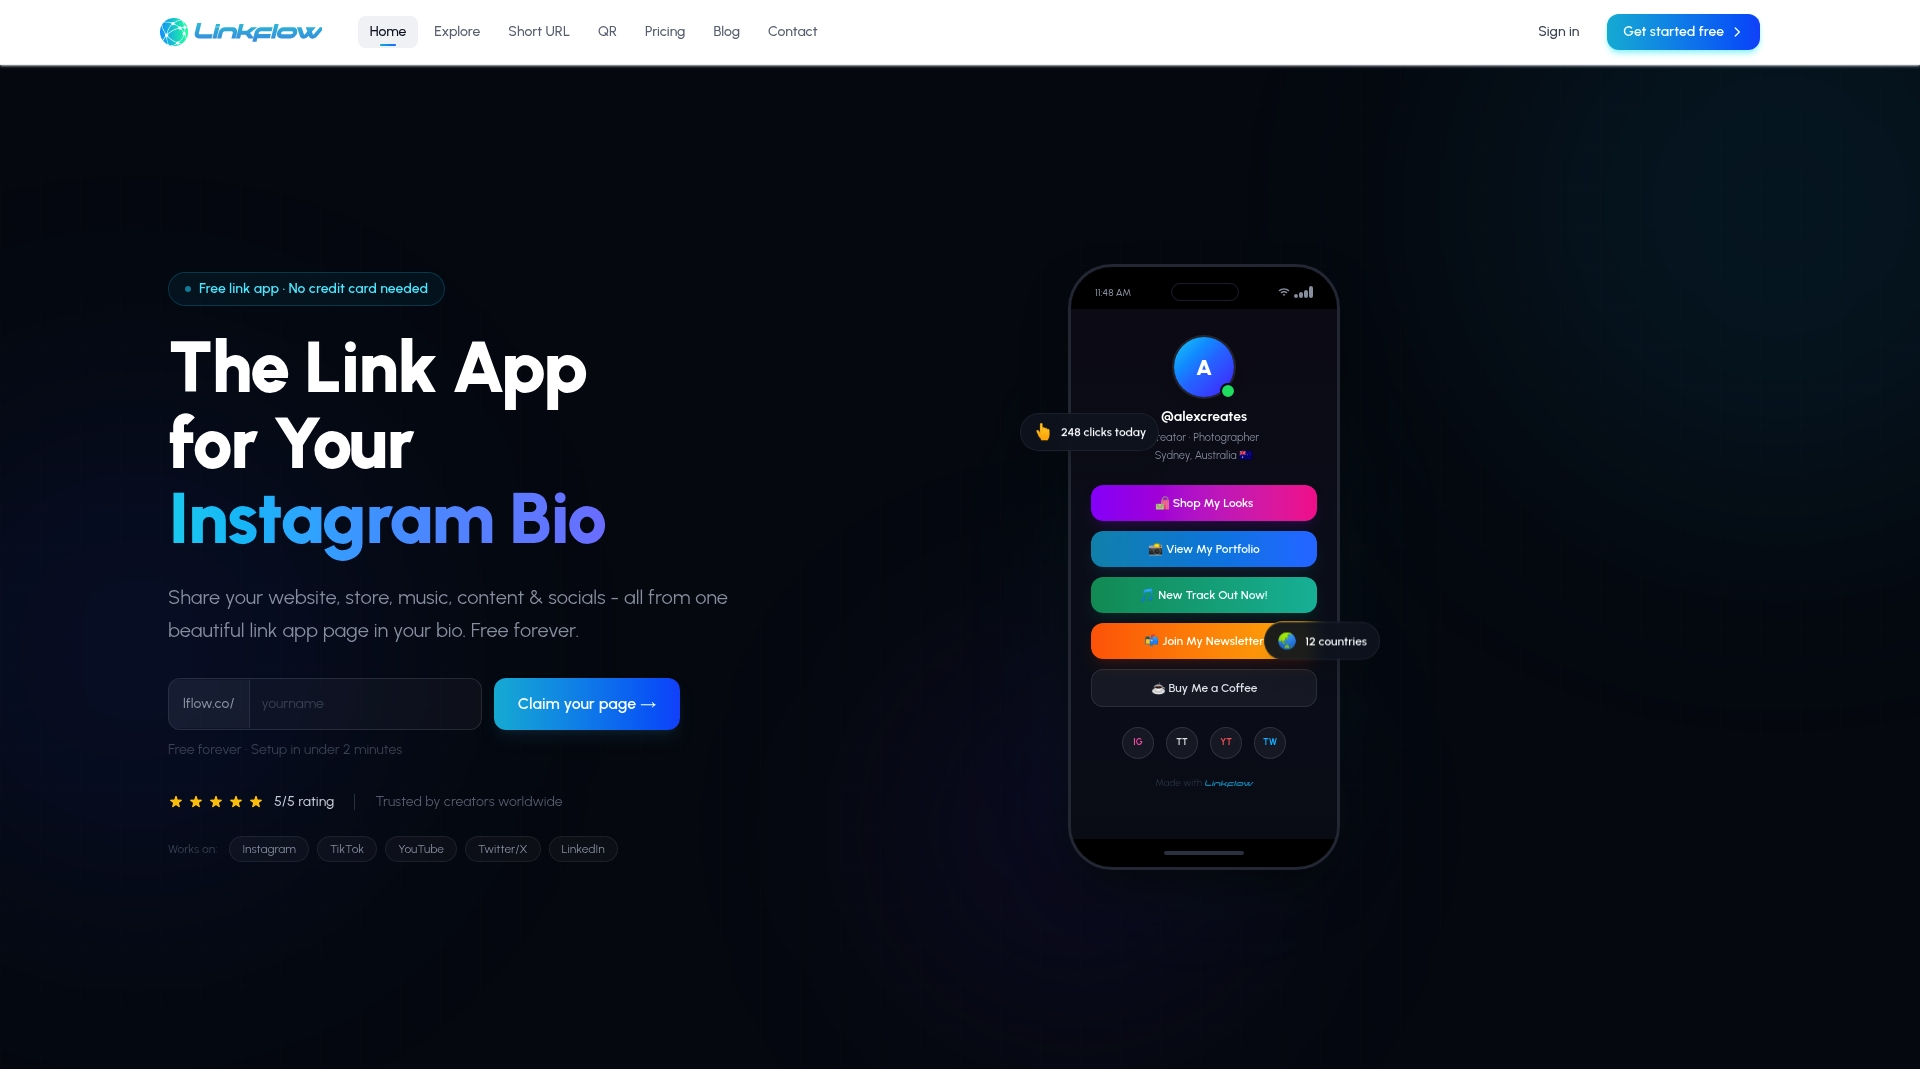
Lflow gives content creators, influencers, and small business owners a single branded URL that consolidates all their links, from stores and videos to social profiles and websites. The platform includes real-time analytics so you can see exactly which links your audience clicks, when they click, and how often they return. Setup takes under two minutes, and the free plan includes unlimited links, a downloadable QR code, and full mobile optimization. If you want to track engagement for free, Lflow is built for exactly that.
FAQ
Why track user engagement instead of just follower count?
Follower count measures audience size, not behavior. Engagement metrics like saves, shares, and return visits predict whether your audience will convert and stay.
What is a good engagement rate for social media?
A good engagement rate falls between 1% and 5% depending on the platform. Instagram and LinkedIn typically see rates at the higher end of that range.
How do engagement metrics connect to revenue?
Engagement metrics are leading indicators. They signal user intent before a purchase or sign-up happens, giving you time to act on high-intent behavior.
What is engagement velocity and why does it matter?
Engagement velocity is the speed at which interactions accumulate after content is published. Platforms favor content with early interaction spikes, giving it wider organic distribution.
How do I separate human engagement from AI agent activity?
Use analytics platforms that filter bot traffic and flag automated interactions separately. In 2026, AI agents account for a significant share of engagement signals in many dashboards, making this filter a standard practice.