

You can measure which exact social post drove a signup by tagging every bio link with UTMs and reading those tags in GA4 or your link-in-bio analytics. That's the whole system. Everything else is implementation.
Start here — your first five actions:
- Create a naming spreadsheet with columns: platform, medium, campaign, post_id
- Tag your next five bio links using lowercase UTMs (e.g.,
?utm_source=instagram&utm_medium=social&utm_campaign=june-freebie) - Shorten each tagged URL with a tool like Lflow's short URL generator before dropping it in your bio
- Check GA4's Traffic Acquisition report after 48 hours to confirm tags are firing
- Set a 4-week review window before drawing any conclusions about platform performance
Table of Contents
- What social media traffic analysis means for creators
- How to stop tracking vanity metrics and focus on KPIs
- How to set up UTM tracking for your link-in-bio page
- How Lflow makes this workflow faster in practice
- How to read your results and decide what to change
- Common tracking mistakes and how to fix them
- Your UTM quick-reference checklist
- Key Takeaways
- The part most creators skip entirely
- Lflow gives you analytics-ready link-in-bio pages from day one
- Useful sources
What social media traffic analysis means for creators
Social media traffic analysis is the practice of collecting and interpreting data about visitors who arrive at your pages from social platforms, then using that data to improve what you post and where you send people. For creators with a link-in-bio page, it answers one question: which posts actually convert?
The catch is that social visitors behave differently from search visitors, so having a professional portrait can improve conversion by making your profile imagery more trustworthy and engaging. Someone who Googled a question is already in research mode. Someone who tapped your Instagram bio link was mid-scroll, in discovery mode, and your page has about three seconds to justify the click. That difference shapes everything: your hook, your page speed, and the single CTA your bio page should show.
There's also the dark social problem. When someone shares your link in a DM or a private Slack channel, GA4 misattributes that click as direct traffic. Tagged links are the only fix. Without UTMs on every bio link, a meaningful slice of your social-driven traffic is invisible.
How to stop tracking vanity metrics and focus on KPIs
Likes and impressions feel good. They rarely pay rent. The distinction that matters, per Hootsuite's 2026 guidance, is the difference between a metric (any number you can count) and a KPI (a metric tied to a specific business goal). Reach is a metric. "Reach grew 15% and drove 200 new email signups this month" is a KPI in action.

Map your metrics to four categories and assign one or two KPIs per category based on your actual creator goals:
| Category | Example Metrics | Creator KPI Example |
|---|---|---|
| Awareness | Reach, impressions, follower growth | Grow monthly reach — |
| Engagement | Likes, comments, saves, shares | Raise engagement rate from 2% by Q3 |
| Conversion | Click-through rate, signup rate, purchases | Achieve CTR on bio link posts |
| Community | Replies, DMs, repeat visitors | Increase return visitor rate month over month |
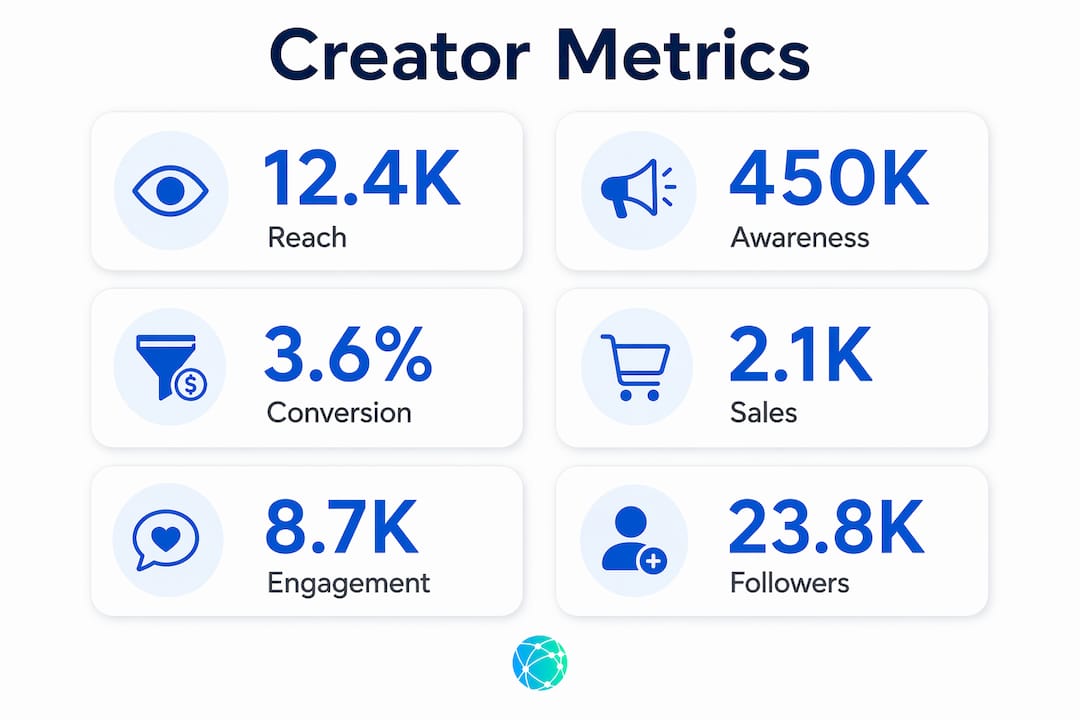
Pick 2–3 KPIs tied to your actual revenue goals first — email signups, paid consult bookings, affiliate purchases — and instrument those before adding anything else. Tracking everything at once produces reports nobody reads.
How to set up UTM tracking for your link-in-bio page
This is the workflow that connects a specific post to a specific conversion. Follow it once, and every future campaign is just filling in the spreadsheet.
- Build your naming spreadsheet. Columns:
platform,medium,campaign,post_id,full UTM URL. Enforce lowercase across every cell — GA4 treatsInstagramandinstagramas two separate sources, which fragments your reports. - Assign utm_source and utm_medium first. Source is the platform (
instagram,tiktok,linkedin). Medium is alwayssocialfor organic posts andpaid_socialfor ads. Never mix them. - Use utm_campaign for the content theme and
utm_contentfor the specific post ID or creative variant. This is what lets you compare a Reel against a carousel from the same campaign. - Shorten the tagged URL. Long UTM strings look messy in bios and captions. A short link hides the query string but preserves the tags in GA4.
- Generate a QR code for the same tagged URL if you promote offline (events, packaging, printed materials).
- Publish and validate. Click the link yourself, then open GA4's Realtime report and confirm the source/medium/campaign appear correctly.
- Monitor in GA4 under Reports → Acquisition → Traffic Acquisition. Switch the primary dimension to "Session source / medium" to see platform rows. For campaign-level data, switch to "Session campaign."
Sample UTM strings:
| Use Case | Example UTM URL |
|---|---|
| Instagram bio link | https://yoursite.com/freebie?utm_source=instagram&utm_medium=social&utm_campaign=june-freebie&utm_content=bio-link |
| TikTok post | https://yoursite.com/freebie?utm_source=tiktok&utm_medium=social&utm_campaign=june-freebie&utm_content=tiktok-vid-01 |
| Paid Instagram ad | https://yoursite.com/freebie?utm_source=instagram&utm_medium=paid_social&utm_campaign=june-freebie&utm_content=ad-v2 |
Pro Tip: Tag influencer or partner posts with a unique utm_content value (e.g., utm_content=collab-partnername) so their traffic stays separate from your own organic posts in every report.
Pairing UTM data with omnichannel link strategies gives you a clean, consolidated view across every platform you post on.
How Lflow makes this workflow faster in practice
Lflow's onboarding takes under two minutes. Once you're in, the workflow above maps directly to its interface.
Create a link card, paste your destination URL with UTMs already appended, and Lflow's real-time analytics dashboard immediately starts recording clicks against those parameters. You see which link card got tapped, when, and from which device, without waiting for GA4 to process sessions.
Lflow's built-in QR code generator creates a scannable code tied to the same tagged URL, so offline promotions feed into the same attribution chain. The features that matter most for this workflow:
| Lflow Feature | What It Does for Tracking |
|---|---|
| Real-time analytics dashboard | Shows click counts per link card immediately |
| UTM-ready link cards | Destination URLs carry full UTM strings through to GA4 |
| Free QR code generator | Offline scans feed the same tagged URL |
| Short URL tool | Hides long query strings while preserving tag data |
| Custom domain | Keeps branded URLs consistent across platforms |
Expect the first two weeks of data to be noisy. Week three is when patterns start to emerge. By week four you'll have enough volume to make a real decision about which post type or platform deserves more of your time.
How to read your results and decide what to change
Social traffic is volatile, so judge trends over 4-week windows, not daily spikes. A single viral post can distort a week's numbers entirely.
- Check engaged sessions first. GA4 marks a session as engaged if it lasts more than 10 seconds, includes two or more page views, or triggers a conversion event. A platform sending high volume but low engaged sessions is a mismatch problem, not a traffic problem.
- Compare conversion rates by platform. If LinkedIn sends 400 sessions at a 3% signup rate and TikTok sends 2,000 sessions at 0.4%, LinkedIn is worth more per click. Allocate content effort accordingly.
- Identify drop-off in the funnel. If clicks from your bio are high but signups are low, the problem is the landing page, not the post. Run a simple A/B test: send half your traffic to a version with a single CTA and the other half to your current page. Run each version for four weeks before calling a winner.
- Session duration under 30 seconds usually means the page didn't match what the post promised. Fix the headline or the first visible element before blaming the platform.
For tracking user engagement beyond clicks, layer in GA4's conversion events: newsletter signup, product purchase, scroll depth, or button click. Each one becomes a measurable outcome you can tie back to a specific UTM tag.
Common tracking mistakes and how to fix them
Inconsistent UTM casing is the most common data problem. Instagram and instagram appear as two separate sources in GA4. Enforce lowercase in your naming spreadsheet and never type UTMs manually into a browser bar.
Missing UTMs on shared links is why dark social shows up as direct traffic. If you share a link in a Story, a DM, or a collab post without a tag, that traffic is lost to attribution. The fix: tag every link before it leaves your spreadsheet, not after.
Sending different platforms to different landing pages makes platform comparisons meaningless. For a fair test, all platforms should point to the same destination URL. Vary the UTM, not the destination.
To validate any tag: click the link yourself, open GA4's Realtime report, and confirm the source, medium, and campaign appear exactly as you typed them. If they don't, the UTM string has a typo or an encoding error.
Pro Tip: Use GA4's custom channel groups to merge fragmented referrer variants like l.facebook.com and lm.facebook.com into a single "Facebook" row. This keeps your social media traffic reports clean without manual filtering every time.
Your UTM quick-reference checklist
Copy this into your tagging spreadsheet and use it before every campaign launch.
- Always include:
utm_source(platform, lowercase),utm_medium(socialorpaid_social),utm_campaign(theme or offer name) - Always add:
utm_contentfor the specific post ID or creative variant - Naming rules: lowercase only, hyphens instead of spaces, no special characters
- Bio link example:
?utm_source=instagram&utm_medium=social&utm_campaign=summer-guide&utm_content=bio-v1 - TikTok post example:
?utm_source=tiktok&utm_medium=social&utm_campaign=summer-guide&utm_content=tiktok-reel-02 - Paid ad example:
?utm_source=instagram&utm_medium=paid_social&utm_campaign=summer-guide&utm_content=ad-carousel-01 - Validate: click the link, check GA4 Realtime, confirm all three core parameters appear correctly
- Review cadence: 4-week windows minimum before making platform-level decisions
Key Takeaways
Consistent UTM tagging is the single action that turns social media data from platform-level noise into post-level attribution you can actually act on.
| Point | Details |
|---|---|
| UTMs unlock post attribution | Without utm_campaign and utm_content, GA4 shows platform but not which post converted. |
| KPIs beat vanity metrics | Track 2–3 KPIs tied to real goals (signups, sales) rather than likes or impressions. |
| Analyze in 4-week windows | Social traffic is volatile; daily checks mislead — commit to monthly review cycles. |
| Combine two analytics layers | Use Lflow's real-time dashboard for speed and GA4 for session depth and conversion paths. |
| Lflow speeds the setup | Lflow's UTM-ready link cards, QR generator, and real-time analytics implement this workflow in under two minutes. |
The part most creators skip entirely
Most creators set up analytics after something goes wrong — a campaign flops, a brand deal falls through, or they realize they can't answer a sponsor's basic question about click-through rates. That's backwards.
The creators who compound their growth fastest are the ones who tag links before they know what the data will show. Early tagging means you accumulate a baseline. Without a baseline, every new campaign is evaluated in a vacuum, and you end up making the same content mistakes on a loop.
The other thing worth saying plainly: the four-category framework (Awareness, Engagement, Conversion, Community) only works if you resist the urge to track all four equally from day one. Pick the category that maps to your current revenue goal and go deep there first. A creator trying to land paid partnerships needs conversion data. A creator building an audience from scratch needs awareness data. Mixing both from the start produces reports that don't tell you what to do next.
The tools are free. GA4 is free. Lflow's analytics are free. The only real cost is the 30 minutes it takes to build a naming spreadsheet and tag your first five links. That investment pays back every time you can tell a brand partner exactly which post drove 200 signups last month.
Lflow gives you analytics-ready link-in-bio pages from day one
Every tactic in this guide requires a link-in-bio page that can carry UTM-tagged URLs cleanly and surface click data without a spreadsheet detour. Lflow is built for exactly that.
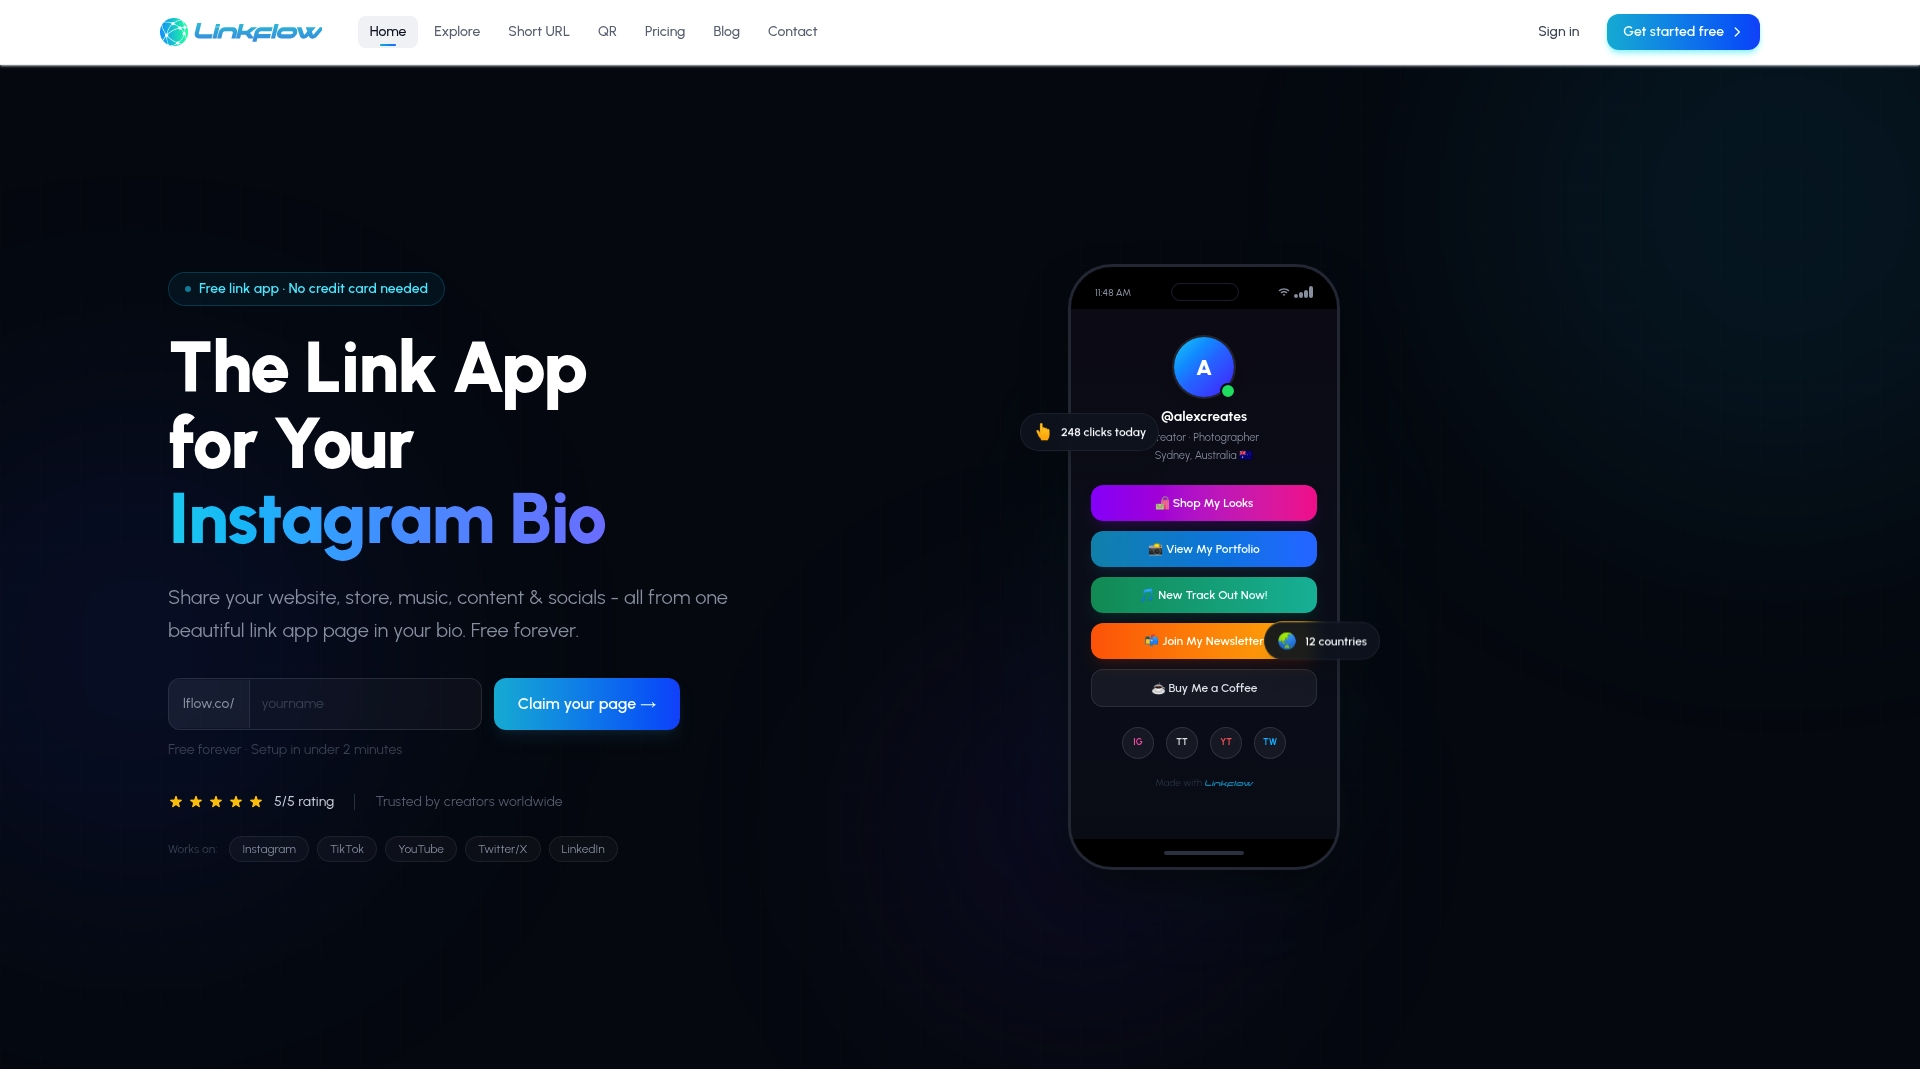
You get real-time analytics, a built-in QR code generator, a short URL tool, and fully customizable link cards — all on a free plan with no setup fee. The onboarding takes under two minutes, and your first tagged link can be live before you finish your next coffee.
- Templates: pre-built link-in-bio templates with link cards ready to accept UTM-tagged destinations
- Real-time analytics: see which link card converts, updated live
- Free QR codes: generate a scannable code for any tagged URL at lflow.co/qr
- Short URLs: mask long UTM strings without losing tag data
- Custom domain: keep your branded URL consistent across every platform
Create your free analytics-ready page at lflow.co and tag your first five bio links today.
Useful sources
| Source | What it covers in this guide |
|---|---|
| Hootsuite: Social media analytics guide | Metrics vs. KPIs distinction; four-category framework; 3–5 KPI recommendation |
| Emilytics: Social media traffic in GA4 | UTM parameter requirements; dark social attribution; 4-week analysis windows |
| Analytics Mania: GA4 social traffic | Custom channel groups; UTM casing and naming normalization |
| Webpeak: What is social media traffic | Discovery-mode intent; landing page speed and hook recommendations |
| Later: Social media analytics advice | Start-small KPI selection; four-category metric mapping |
| SocialPilot: GA4 for social media | Combining link-in-bio analytics with GA4 for speed and depth |