

Click fraud analytics, in the context that matters to creators, means separating real human clicks and scans on your link-in-bio page, branded short links, and QR codes from bot traffic, preview fetches, and scraper hits that inflate your numbers. The fix is straightforward: switch to real-time, human-filtered analytics, and give every placement its own short link with UTMs attached. Lflow builds both into its free tier, which makes this a same-day fix rather than a future project.
TL;DR:
- Filtering out preview bots and scraper hits provides a more accurate count of genuine human clicks that matter for conversions and revenue.
- Using dedicated short links and UTMs for each placement ensures precise attribution and avoids referrer data stripping, especially in in-app browsers.
- Monitoring key metrics such as revenue per click, conversion rate, and engaged sessions helps prioritize links by actual business impact rather than raw traffic volume.
- Setting specific check-in times after posting prevents overreacting to invalid spikes caused by preview fetches and external automated traffic.
- Recognizing patterns like clustered high-traffic spikes from bots or datacenter IPs can save creators from chasing phantom engagement statistics.
Table of Contents
- What Click Fraud Analytics Means for Creators Using Short Links and QR Codes
- Why Real-Time, Human-Filtered Metrics Change What You Decide
- How to Spot Suspicious or Misleading Clicks
- Real-Time Monitoring Rules for Launches and QR Campaigns
- Setting Up Clean UTMs, Short-Link Names, and QR Tracking
- Turning the Numbers Into a Decision
- Common Patterns Behind Inflated Click Numbers
- Tools and Technologies That Catch the Noise
- Methodologies for Making Sense of the Data
- What Inflated Clicks Actually Cost You
- A Practical Walkthrough of Human-Filtered Analytics
- What Creators Consistently Get Wrong About Click Data
- Set Up Human-Filtered Analytics in Under Two Minutes
- Sources
What Click Fraud Analytics Means for Creators Using Short Links and QR Codes
This is not the pay-per-click fraud you'll find in most search results about competitors clicking your Google Ads to burn your budget. That's a different problem for a different audience. Here, click fraud analytics refers to something narrower and more useful: figuring out which clicks and scans on your bio link or QR code came from actual people versus automated systems.
Preview bots are the biggest offender. When someone shares your link on Slack, iMessage, or Discord, the app fetches the page to generate a preview card before a human ever taps it. Scrapers and prefetchers do the same thing silently. These show up as clicks in the first sixty seconds, and if your dashboard doesn't isolate them, your launch numbers lie to you. A dedicated "human clicks" metric, separate from raw hits, is the difference between real signal and noise.
Why Real-Time, Human-Filtered Metrics Change What You Decide
Raw click counts tell you almost nothing about whether a link is working. Revenue per click, conversion rate, and engaged session length tell you everything. A pinned comment might drive triple the clicks of your bio link and still lose on revenue per click if the traffic never converts.
Placement matters more than most creators assume. A newsletter click carries different intent than a bio-link tap during a scroll session, and a QR scan at a merch table means something else again. AI-driven link analytics can now cluster traffic by source and behavior to estimate conversion likelihood, so you're prioritizing links by their actual business impact instead of their click volume.
The metrics worth watching:
- Revenue per click — ties traffic directly to earnings, not just attention
- Conversion rate — the percentage of human clicks that complete the action you wanted
- Assisted conversions — clicks that didn't convert directly but influenced a later purchase
- Engaged sessions — visits where someone actually interacted with the destination page
Real-time data earns its keep during the first hour of a launch. Once that window passes, daily roll-ups usually tell you everything you need.
How to Spot Suspicious or Misleading Clicks
Separating human engagement from automated noise takes a few habits, not expensive software. Here's the sequence that works:
- Check user-agent strings and IP ranges. Clicks originating from known datacenter IP blocks or bot-flagged user agents almost never represent a real person tapping your link.
- Watch timestamp clustering. A dozen clicks landing within the same second, especially right after you post, usually means a preview fetch or scraper, not a human audience.
- Use one short link per placement. A link/QR generator like Lflow lets you create a unique short link for your bio, your newsletter, and your pinned comment, so you're never guessing which placement drove which clicks.
- Maintain a human-click denominator. Calculate conversion rate against filtered human clicks, not total clicks, or every percentage you report will be artificially low.
- Run a test click before launch. Click your own link, confirm the destination loads correctly, and verify the event registers in your dashboard before you tell your audience to click it.
- Watch the click-to-conversion lag. Real purchases and sign-ups usually land seconds to minutes after a click. A wall of clicks with zero conversions for hours is a red flag worth investigating.
- Export raw event data periodically. A CSV export lets you cross-reference clicks against known bot IP lists or unusual patterns your dashboard might not flag automatically.
Pro Tip: Run your test click from a different network than the one you'll be posting from. Some in-app browsers behave differently depending on connection type, and you want to catch a broken redirect before your audience does, not after.
For a deeper look at how link tracking actually works under the hood, Lflow's guide to link tracking breaks down the mechanics without the jargon.
Real-Time Monitoring Rules for Launches and QR Campaigns
Set specific check-in times instead of refreshing your dashboard all day. Checks at 15, 30, and 60 minutes after a post goes live catch the problems that matter: a broken redirect, a UTM typo, or a landing page that doesn't match what you promised. After that first hour, the diagnostic value of live data drops off sharply, and hourly or daily summaries do the job just as well.
Your live dashboard should show four things at a glance: click rate, unique clicks, referrer breakdown, and conversion event rate. If any of those is missing, you're flying partially blind during the window that matters most.
What to actually do at each check-in:
- At 15 minutes: confirm the link resolves and events are firing at all
- At 30 minutes: compare referrer sources against where you actually posted
- At 60 minutes: decide whether to pause a paid boost, fix a broken UTM, or leave it running
Preview bots and in-app fetches often create a spike in the first few minutes that looks like a surge in interest but isn't. Platforms that don't filter these by default will show you a false peak right when you're most likely to overreact to it.
The guardrail here matters as much as the checklist. Checking every five minutes doesn't give you better data, it just gives you more anxiety and a higher chance of making a change before you have enough clicks to know if something's actually wrong. Set your three checkpoints, act on what you see, then step away until the next one.
Setting Up Clean UTMs, Short-Link Names, and QR Tracking
Messy naming is the number one reason creators can't trust their own numbers three months later. Fix it once, upfront, with these steps:
- Build a naming convention with three parts: campaign name, channel, and placement slug (something like
summer-drop_ig_bioversussummer-drop_email_footer). - Add UTMs to the destination URL before you shorten it. Never rely on a platform's referrer data alone, since in-app browsers on Instagram and TikTok routinely strip that information before it reaches your analytics.
- Give every placement its own short link. A dedicated link per placement survives referrer stripping and lets you attribute conversions accurately even when the platform itself won't tell you where the click came from.
- Treat QR scans exactly like placement clicks. Expect a batch of preview fetches immediately after you print or post a QR code, and tag each code with its own offline campaign identifier (flyer, merch table, poster) so scan data doesn't blend into your online numbers.
- Set an export retention window. Pull your CSV data on a schedule so you can join click timestamps to conversion timestamps later, especially if your conversion event happens on a separate platform like Shopify or Stripe.
Lflow's guide to link monitoring walks through more of the operational side if you're setting this up for the first time.
Turning the Numbers Into a Decision
Judge every link and every placement by conversion rate and revenue per click, not by which one got the most taps. A bio link with many clicks but a low conversion rate is doing less for you than a newsletter link with fewer clicks but a higher conversion rate. Set a minimum sample size before you act. Ten clicks telling you "it's not working" is noise, not a verdict.
When you see high clicks paired with low conversions, work through it in order:
- Check whether the destination page actually matches what you promised in the post
- Confirm the UTM parameters weren't dropped or malformed during shortening
- Look at the referrer breakdown for an unusual concentration from one bot-heavy source
- Compare the timing of the spike against when you actually posted, not when it appeared
If you're reporting results to a brand sponsor or partner, report the human-filtered numbers, not the raw click count. A sponsor who sees your unfiltered clicks and later discovers a third of them were bot traffic will trust your next campaign less, not more. Reporting engagement metrics honestly is worth the extra five minutes it takes to filter the data first.
Common Patterns Behind Inflated Click Numbers
Most of the click inflation creators encounter falls into a handful of repeatable patterns, and recognizing them saves you from chasing phantom problems.
Preview and crawler spikes are the most common. Every time your link gets shared in a group chat, messaging app, or social platform's compose box, an automated system fetches it to build a preview card. This happens before a single human sees the post, and it can account for a meaningful chunk of your first-minute click count.
Datacenter traffic shows up when links get scraped by SEO tools, competitor monitoring services, or general web crawlers indexing your page. These clicks cluster from cloud-hosting IP ranges rather than residential or mobile networks.
Click-farm style patterns are rarer for creator link pages than for paid ads, but they do appear, usually as a burst of clicks from a narrow geographic region with no corresponding engagement on the destination page.
Self-inflicted duplication happens more than creators like to admit. Testing your own link repeatedly, or a team member checking it from multiple devices, adds up fast if you're not filtering your own traffic out of the count.
Redirect loops and broken shorteners aren't fraud in the traditional sense, but they generate repeat automated hits that look identical to a bot pattern in your dashboard, and they're worth ruling out before you assume something malicious is happening.
Tools and Technologies That Catch the Noise
You don't need enterprise ad-fraud software to handle this at the link-in-bio scale. The tools that matter for creators are simpler and more targeted.
A link and QR platform with built-in bot filtering is the foundation. Lflow filters known preview bots and datacenter traffic by default, so the click count you see on your dashboard is closer to a human number from the start rather than something you have to clean up yourself afterward.
Beyond that, a CSV export function turns your platform into a forensic tool when you need one. Raw event-level data, exported and cross-referenced against public lists of known bot IP ranges, catches what automatic filtering misses.
For creators also running paid promotion alongside organic content, it's worth understanding how paid search platforms handle traffic quality, since paid clicks follow different verification rules than the organic shares and QR scans this article focuses on.
Methodologies for Making Sense of the Data
The most reliable method is also the simplest: filter first, then analyze. Strip out known bot and preview traffic before you calculate any rate metric, because a conversion rate calculated against unfiltered clicks will always understate your real performance.
From there, AI-assisted analytics can cluster traffic by device, source, and behavioral pattern to flag which segments are worth trusting and which look anomalous. This matters more as your audience scales, since manually eyeballing a spreadsheet of a few hundred clicks a day stops being practical fast.
Cohort thinking helps too. Compare this week's placement performance against the same placement last week, rather than against a different placement entirely. Apples-to-apples comparisons across the same slug catch drift and anomalies that a one-time snapshot won't.
What Inflated Clicks Actually Cost You
The direct cost isn't usually money, since most creators aren't running paid ads against these links. The cost is worse: bad decisions. If you scale a placement because it "got the most clicks" and half of those were preview bots, you're investing time and creative energy into a channel that isn't actually reaching people.
The indirect cost compounds. Sponsors and brand partners increasingly ask for engagement data before renewing deals, and a click count padded with bot traffic sets an expectation you can't repeat. When the next campaign's real numbers come in lower, it looks like your audience shrank, when really your measurement just got worse before it got honest.
A Practical Walkthrough of Human-Filtered Analytics
Here's how the filtering process actually plays out for a typical launch. A musician drops a single and posts the bio link across Instagram, TikTok, and a pinned tweet, each with its own short link and UTM tag. In the first two minutes, the dashboard shows forty clicks. A quick look at the referrer and timestamp data shows twenty-two of them landed within the same three-second window, all from datacenter IP ranges. Those are Instagram's and TikTok's preview fetches, not fans.
The remaining eighteen clicks spread naturally over the next ten minutes, matching a realistic human posting-to-click pattern. That's the number worth tracking against streaming platform conversions. By the sixty-minute mark, the pinned tweet's placement link shows a conversion rate nearly triple the Instagram bio link, even with fewer total clicks, because the audience there clicked with more specific intent.
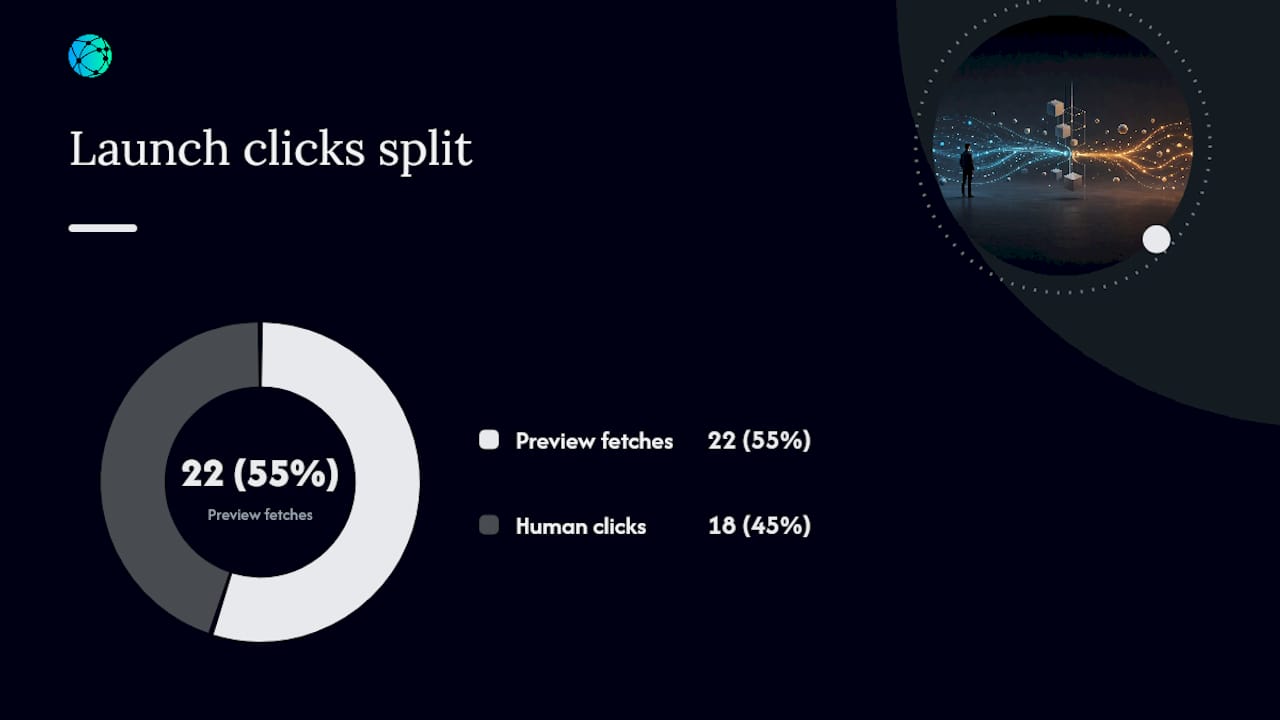
This is the practical value of separating human clicks from automated noise: it turns a flat number into a decision about where to focus the next post.
What Creators Consistently Get Wrong About Click Data
Most creators treat every click as equal, and that single assumption causes more bad decisions than any bot or scraper does. A click from a preview fetch, a click from a curious scroller, and a click from someone ready to buy all land in the same "clicks" column on most basic dashboards, and that column tells you almost nothing useful on its own.
The bigger blind spot is timing bias. Creators who obsess over the first five minutes after posting are reacting to the noisiest, least representative window of their entire campaign. That's exactly when preview bots fire, when your own team double-checks the link, and when the sample size is too small to mean anything. The instinct to watch a dashboard refresh in real time feels productive. It's usually the opposite of useful unless you're using that window specifically to catch a broken redirect, not to judge audience interest.
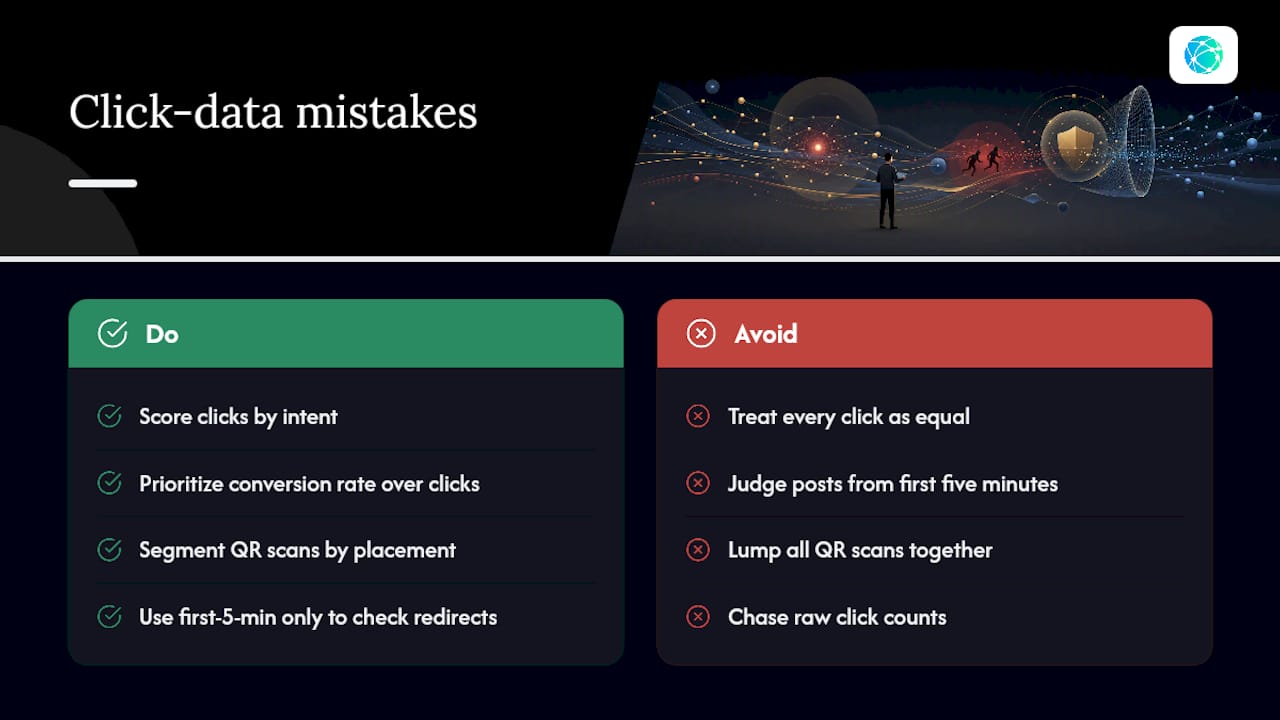
What the research on link performance keeps confirming is that quality signals, not volume, predict what happens next. A smaller pool of intent-scored clicks beats a larger pool of unfiltered ones every time you're trying to decide whether to double down on a placement or drop it. Creators who internalize that stop chasing click counts and start chasing conversion rate, and that shift alone changes what they post next.
The other underrated point: QR codes get treated as an afterthought measurement-wise, when they deserve the same placement-level rigor as a digital link. A scan at a merch table and a scan on a flyer are different audiences with different intent, and lumping them into one generic "QR" bucket throws away exactly the data that would tell you which offline channel is actually worth the print costs.
— Axion
Set Up Human-Filtered Analytics in Under Two Minutes
Lflow is built around the exact workflow this article describes: create a link-in-bio page, generate a placement-specific short link or QR code for each channel, and watch human-filtered clicks come in on a live dashboard instead of a raw, unfiltered count.
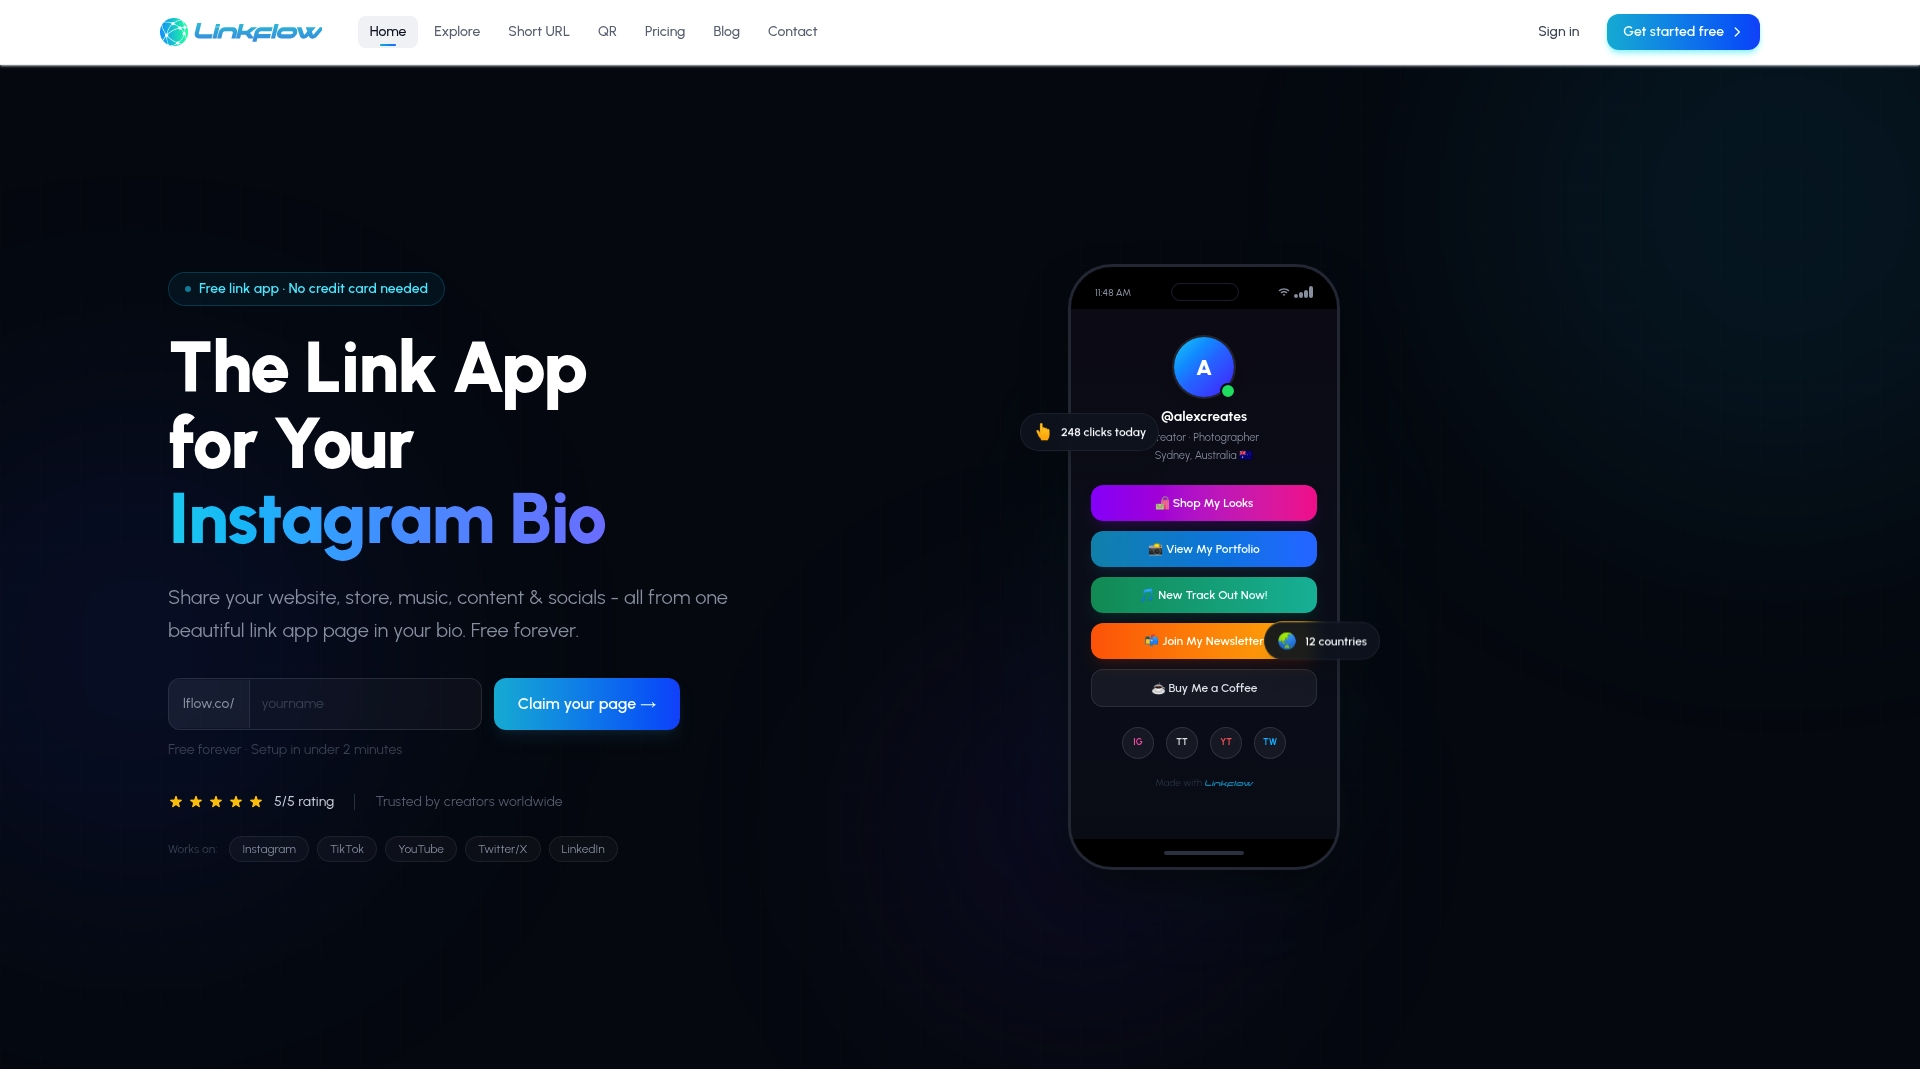
The features map directly onto what's covered above:
| Best practice from this article | Lflow feature |
|---|---|
| Filter bot and preview traffic | Real-time analytics with automatic filtering |
| One short link per placement | Unlimited branded short links |
| Offline scan tracking | Free downloadable QR code generator |
| Forensic checks on raw events | CSV data export |
| Fast setup before a launch | Under two-minute onboarding |
Pro Tip: When you set up your first campaign, create your placement links before you write your captions, not after. It forces you to decide upfront exactly which channels you're measuring, instead of retrofitting UTMs onto a post that's already live.
Start with the free link-in-bio page, which includes unlimited links and QR code generation at no cost, or browse ready-made templates if you want your page live before your next post goes out. If your primary need right now is offline scan tracking, the standalone QR generator gets you a trackable code in minutes.
Sources
- AI Link Analytics for Creators: Beyond Vanity Clicks
- Real-time link analytics — watching campaigns as they happen
- How to Track Which Posts Drive Sales, Not Just Clicks | Flyn