

Analytics is what turns a link-in-bio page from a static list of URLs into a measurable growth engine. When you track which posts drive clicks, which clicks convert, and which content earns revenue, you stop guessing and start making decisions that compound.
Three things analytics proves immediately:
- Which social posts actually send traffic to your link page (attribution)
- Whether that traffic converts to sales, signups, or leads (conversion evidence)
- Which creative formats and CTAs earn the most clicks per impression (creative validation)
Minimum instrumentation to start today:
- Add UTM parameters to every link you post (source, medium, campaign)
- Create a short link or QR code for your bio URL
- Fire one landing-page event in Google Analytics 4 (GA4) when a visitor arrives
Lflow.co handles all three in one place: short links, QR codes, and real-time click analytics built into your link hub, with setup under two minutes.
Table of Contents
- Why does analytics matter for creators using link-in-bio pages?
- What metrics should you actually track for link engagement?
- How do you set goals and KPIs with a 30/60/90 timeline?
- What tools and setup do you need to measure link-in-bio performance?
- How do you turn analytics data into tests and real improvements?
- What privacy and data-accuracy issues affect U.S. creators?
- What mistakes do creators make most often with link analytics?
- What does a monthly analytics routine look like?
- Key Takeaways
- The gap between tracking and deciding
- Lflow.co makes link-in-bio analytics faster to set up
- Useful sources and further reading
Why does analytics matter for creators using link-in-bio pages?
Sponsorships, brand deals, and ad budgets all come down to one question: can you prove the return? Without data, you're asking someone to trust your gut. With it, you're showing a conversion rate.
Analytics drives revenue by connecting social activity to outcomes like leads and sales. That connection is what secures investment and executive support. For independent creators, it's the difference between renewing a sponsorship and losing it.
Only 22% of senior decision-makers are classified as "Empowered Organizations" that operationalize analytics into core strategy — and that group consistently achieves higher marketing ROI than those using analytics only for reporting.
A product launch tracked through a link-in-bio page is a clean example. Tag the Instagram post with a UTM, route traffic through a short link, and fire a purchase event on the destination page. Now you can tell a brand partner exactly how many sales that one post generated. That's the conversation that gets you rehired.
Analytics also shifts the frame from vanity metrics to outcome-based decisions. Follower counts and likes look good in screenshots. Conversion rate and revenue per click are what actually justify where you spend your time.

What metrics should you actually track for link engagement?
Most creators track the wrong things. Intent-based metrics like saves, shares, profile visits, website clicks, and DMs are far better predictors of conversion than likes or follower growth.
Core metrics for link-in-bio performance:
- Clicks: total taps on your bio link or individual short links
- CTR (click-through rate): clicks ÷ impressions, expressed as a percentage
- Profile visits: how many people moved from a post to your profile (a pre-click intent signal)
- Conversion rate: conversions ÷ clicks; tells you what percentage of link visitors took the target action
- Revenue per click: total revenue ÷ total clicks; the clearest ROI metric for monetized pages
- Saves and shares: high-intent signals that a post resonated enough to revisit or recommend
- Bounce rate / dwell time: how long visitors stay on your landing page after clicking
Quick KPI formulas:
| Metric | Formula |
|---|---|
| CTR | (Clicks ÷ Impressions) × 100 |
| Conversion rate | (Conversions ÷ Clicks) × 100 |
| Revenue per click | Total revenue ÷ Total clicks |
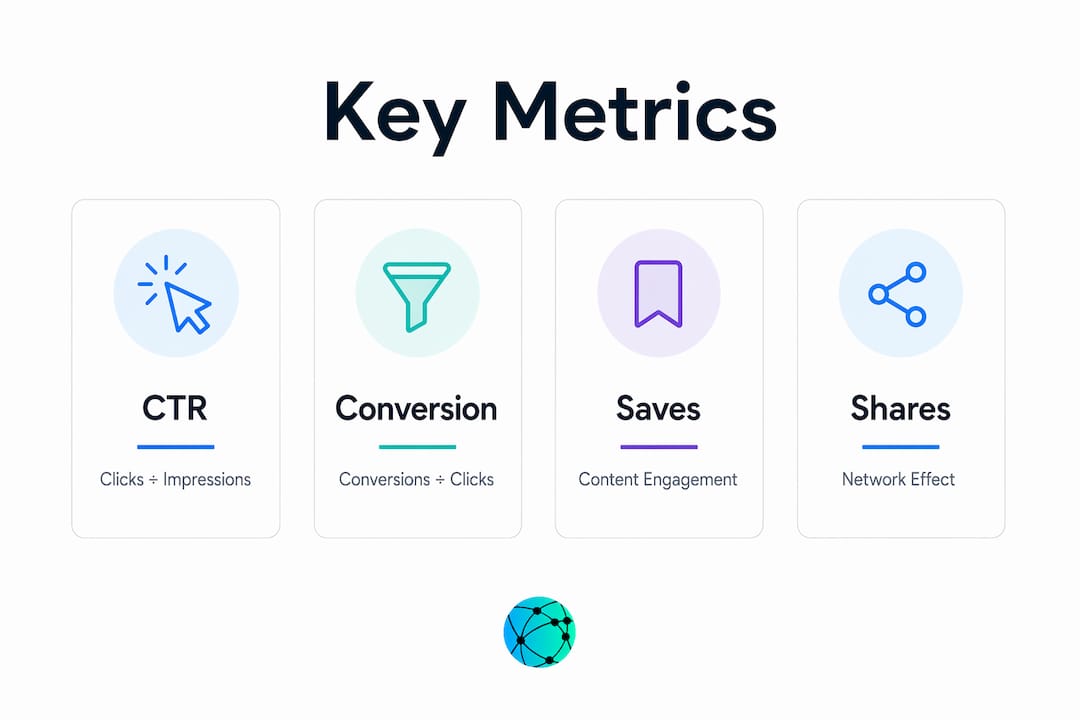
Saves and shares deserve special attention. Modern analytics has moved well beyond follower counts toward network effects and audience behavior signals. A post with 200 saves and 50 clicks tells you the content resonated but the CTA underperformed. That's a specific, fixable problem.
How do you set goals and KPIs with a 30/60/90 timeline?
Convert every business goal into a specific link-in-bio behavior. "Grow sales" becomes "achieve a 3% conversion rate on the product link within 60 days." Vague goals produce vague results.
| Goal | KPI | Target | Timeframe |
|---|---|---|---|
| Drive product sales | Conversion rate on shop link | 3% | 60 days |
| Build email list | Signups via bio link | — | 30 days |
| Grow course enrollments | Revenue per click | — | 90 days |
| Increase sponsorship value | CTR on brand link | 5% | 30 days |
What to expect at each stage:
- Days 1–30: Learning window. Collect baseline data, identify your top-performing post types, and confirm your tracking fires correctly.
- Days 31–60: Optimization window. Run one creative or CTA test per cycle. Analytics reviewed monthly catches operational signals; quarterly reviews catch strategic ones.
- Days 61–90: Scaling window. Double down on what worked, cut what didn't, and set the next 90-day target.
Resource reality: a 30-day test costs almost nothing beyond your time. One creative variant, one UTM, one GA4 event. You don't need an ad budget to run a meaningful measurement sprint.
What tools and setup do you need to measure link-in-bio performance?
The minimum stack: native platform analytics (Instagram Insights, TikTok Analytics, Meta Business Suite) plus GA4 for destination tracking, UTMs for source attribution, and a link hub like Lflow.co to centralize everything.
Cross-platform tools create a single source of truth that native dashboards can't provide alone. Toggling between Instagram Insights and TikTok Analytics to compare performance manually wastes time and introduces errors.
Setup checklist:
- Configure GA4 basics: create a property, install the tag on your landing page, and confirm pageview events are firing.
- Standardize UTM parameters: pick a naming convention and stick to it (e.g.,
utm_source=instagram&utm_medium=bio&utm_campaign=spring-launch). - Create short links and QR codes: use Lflow.co to generate a trackable short link and a downloadable QR code for each campaign.
- Instrument destination events: set up a GA4 conversion event (e.g.,
purchase,sign_up, orgenerate_lead) on your landing page. - Build a simple dashboard: pull GA4 data into a Google Looker Studio report or export CSV from Lflow.co for a quick weekly snapshot.
Pro Tip: Name your UTMs by content type and date, not just campaign name. utm_campaign=reel-tutorial-jan15 tells you exactly which piece of content drove the traffic when you review data six weeks later. Generic names like utm_campaign=q1 become useless the moment you run more than one post.
Gartner's guidance on data architecture consistently points to a single source of truth as the foundation for faster, more accurate decisions. For creators, that source of truth is GA4 fed by UTM-tagged links from a centralized hub.
How do you turn analytics data into tests and real improvements?
The core rule: compare intent signals (saves, shares, profile visits) to conversion outcomes, then test the weakest step in that chain.
Simple decision rules:
- CTR up, conversion rate down → the landing page experience is the problem, not the post
- Saves up, clicks down → the CTA in the caption or bio needs to be more direct
- Profile visits up, bio clicks flat → the link page itself may need a layout or copy change
A practical test cycle: pick one hypothesis, set a control (your current post format or CTA), run for 14–30 days, measure the target metric, then decide: keep, iterate, or cut.
Auditing clicks back to the specific post that drove the profile visit is the step most creators skip. Post-level attribution tells you whether your Reels, carousels, or Stories are actually sending traffic, not just generating views.
Data analytics also enables proactive brand decisions: detecting early sentiment shifts, validating positioning, and pressure-testing messages through A/B tests before committing budget.
What privacy and data-accuracy issues affect U.S. creators?
Data accuracy problems quietly distort your numbers. Bot traffic inflates clicks, cookie restrictions reduce attribution, and inconsistent UTMs create gaps in your reports.
| Audit step | What to check | Frequency |
|---|---|---|
| Bot traffic filter | GA4 "Known bots and spiders" filter enabled | Monthly |
| Cross-domain tagging | GA4 cross-domain config if links span multiple domains | Quarterly |
| UTM hygiene | No broken, missing, or duplicate UTM strings | Monthly |
| Sampling check | GA4 reports not sampled (use unsampled exports) | Quarterly |
U.S.-specific considerations:
- CCPA consent requirements can reduce cookie-based tracking for California visitors; first-party data and server-side events reduce that loss.
- iOS privacy changes have made last-click attribution less reliable for Instagram and Facebook traffic; use UTMs on every link rather than relying on referrer data.
- GA4's default data retention is 14 months; export CSV data from Lflow.co regularly so you don't lose historical click records.
Monthly quick checks take under 30 minutes. Quarterly deeper audits, ideally with a second set of eyes, catch structural issues before they corrupt a full quarter of data.
What mistakes do creators make most often with link analytics?
The most common error is treating vanity metrics as outcomes. High impressions with zero clicks means your content is visible but not compelling. That's not a win.
Red flags and fixes:
- Inconsistent UTM naming (e.g.,
Instagramvs.instagramvs.IG): enforce a UTM template in a shared doc and never deviate. - Traffic spikes with zero conversions: inspect for bot traffic immediately; check GA4's real-time report for suspicious session patterns.
- All links pointing to the same destination: if every bio link goes to your homepage, you can't measure which offer or content type converts.
- No baseline data: running a test without knowing your pre-test conversion rate makes results meaningless.
- Checking analytics daily: daily data is mostly noise. Weekly minimums, monthly for decisions.
A "measurement smell" worth acting on immediately: your GA4 shows 500 sessions from Instagram this week, but your Lflow.co dashboard shows only 80 clicks on the bio link. That gap usually means UTMs are broken or traffic is arriving through a different path than you think.
What does a monthly analytics routine look like?
The single priority for monthly reviews: track directional trends and validate your top hypothesis for the month. Not every metric, every month.
Monthly checklist:
- Review your top 10 posts by profile visits and saves
- Map which posts drove the most bio link clicks (post-level attribution in GA4)
- Check top landing pages by conversion rate
- Run one micro-test (new CTA, new link order, new short link for a specific offer)
- Export CSV of link click data from Lflow.co for your records
After three months of consistent monthly reviews, you'll have enough directional data to make a 90-day strategic call: which platform to prioritize, which content format to scale, and which links to retire.
Key Takeaways
Analytics converts link-in-bio clicks into measurable business outcomes when you track the right metrics, instrument your links correctly, and review data on a consistent monthly cadence.
| Point | Details |
|---|---|
| Instrument every link | Add UTMs, a short link, and one GA4 conversion event before publishing any post. |
| Track intent metrics | Saves, shares, and profile visits predict conversions better than likes or follower count. |
| Use a 30/60/90 timeline | Spend 30 days on baseline, 30 on testing, and 30 on scaling what worked. |
| Audit data monthly | Check bot filters, UTM hygiene, and cross-domain tagging every month to keep numbers clean. |
| Centralize with Lflow | Lflow.co consolidates short links, QR codes, and real-time click analytics in one free hub. |
The gap between tracking and deciding
Most creators set up analytics once and then treat the dashboard as a scoreboard. They check the numbers, feel good or bad about them, and move on. That's not measurement. That's just watching.
The creators who actually grow from data do something different: they use it to make one specific decision per cycle— not ten decisions, not a full content overhaul. One: which link to promote this week, which CTA to rewrite, which platform is sending traffic worth chasing.
Only 22% of organizations operationalize analytics into core strategy and consistently achieve higher marketing ROI. They don't have better tools—they have better habits. They've decided that data answers a question, not just fills a report. For a solo creator or a small brand, that shift costs nothing except the discipline to ask the question before you look at the numbers.
Export your CSV. Set your one hypothesis. Run your 30 days. The compounding effect of small, data-backed decisions is what separates accounts that plateau from ones that keep growing.
Lflow.co makes link-in-bio analytics faster to set up
Real-time click data, free QR codes, and short links for every destination in your bio: Lflow.co gives you the measurement infrastructure most creators spend hours cobbling together from separate tools.
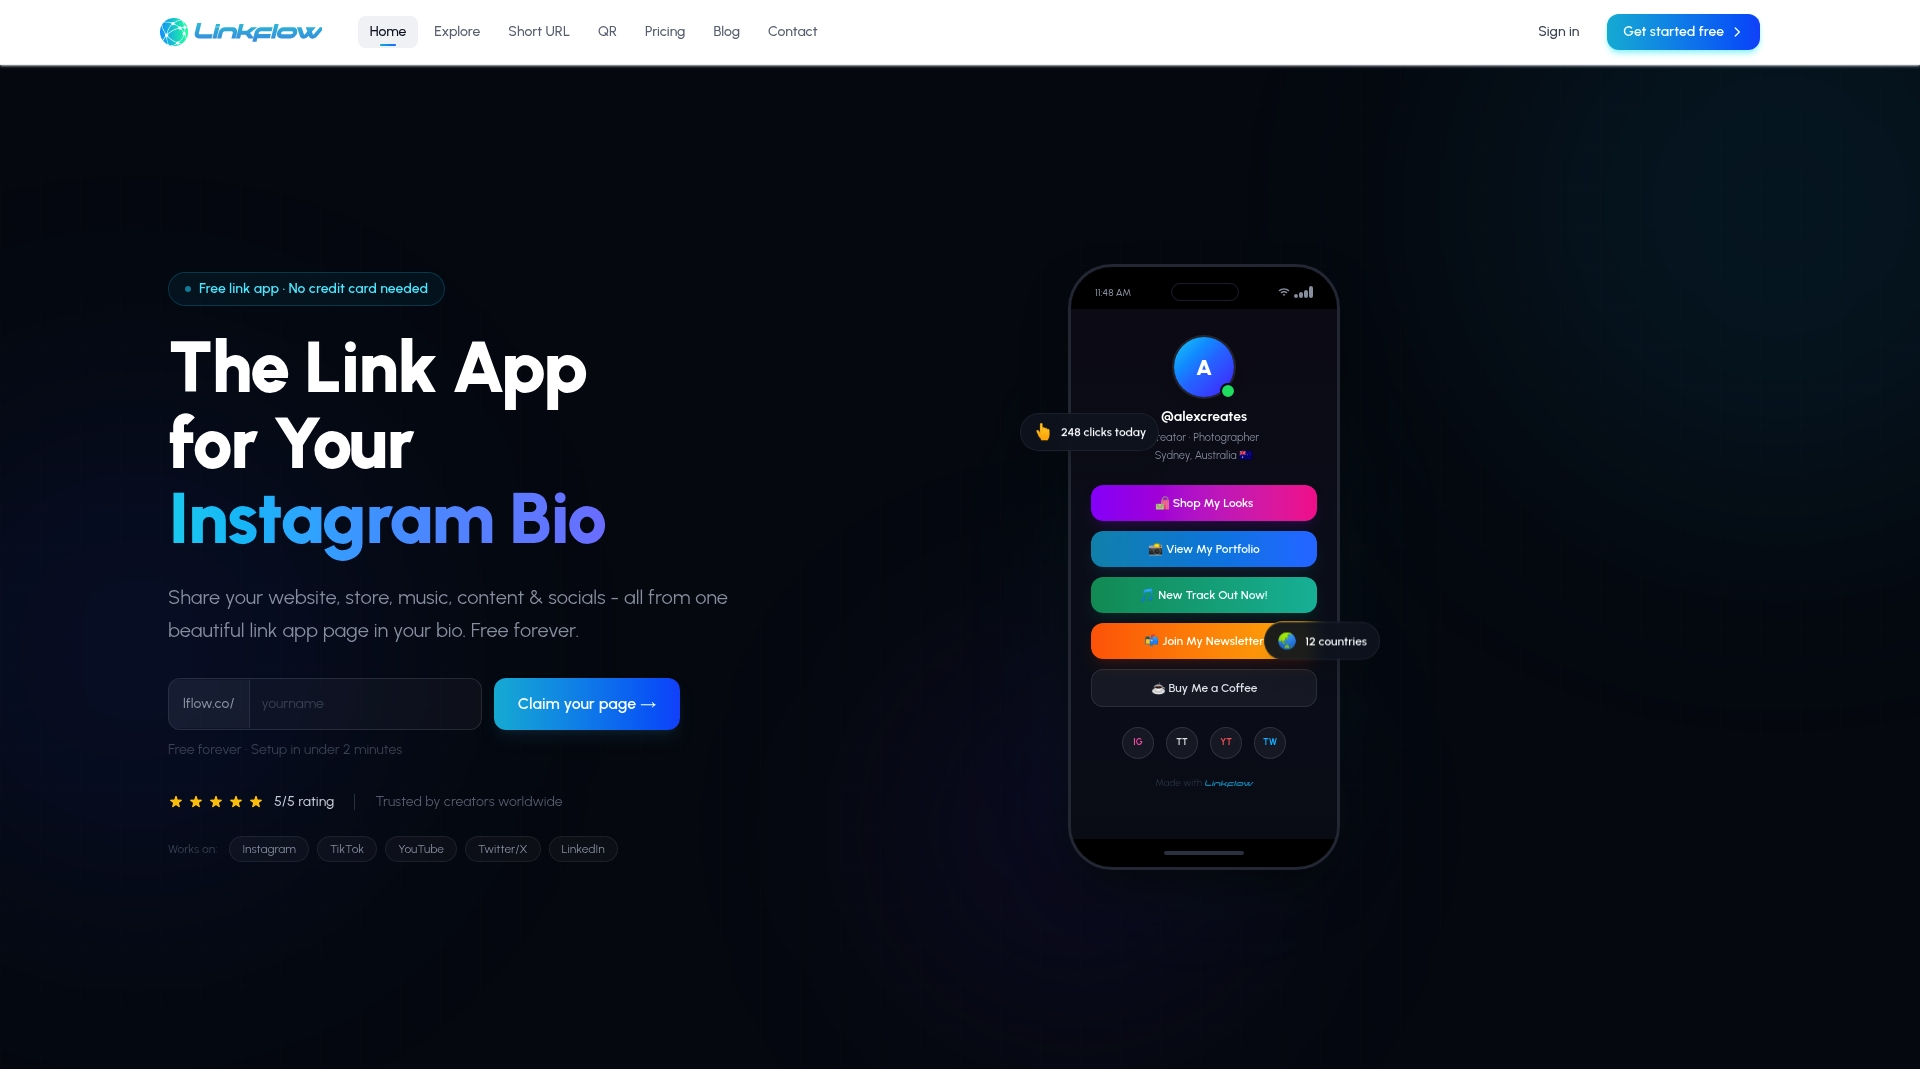
The free plan includes unlimited links, real-time analytics, and a downloadable QR code for each link. Add UTMs to your links inside the platform, and every click is automatically attributed to its source. When you're ready for custom domains, CSV exports, and advanced analytics, the paid plan adds those without a long-term contract.
Getting started takes under two minutes. Create your free link-in-bio page, add your links with UTM parameters, and your first 30-day measurement sprint starts the moment you publish.
Useful sources and further reading
- Analytic Partners: The $40M Divide — The source for the 22% "Empowered Organizations" finding; useful for understanding why operationalizing analytics correlates with higher ROI.
- Sprout Social: Social Media Analytics — Covers the full case for connecting social activity to business outcomes; good reference for ROI framing and tool selection.
- Conbersa.ai: Social Analytics Guidance — Practical breakdown of intent vs. vanity metrics and recommended review cadences (monthly/quarterly/annual).
- Later: Social Media Analytics — Specific guidance on post-level attribution and auditing clicks back to the originating content.
- Gartner: Data and Analytics — Architecture guidance on building a single source of truth; supports the cross-platform stack recommendations.
- Brand Quarterly: Data Analytics for Brand Decisions — Covers proactive analytics use: sentiment monitoring, message testing, and A/B validation.
- Xpoz.ai: Social Media Analytics Complete Guide — Useful for understanding network effects, follower quality signals, and the shift toward intent-based measurement.