

The analytics creators should prioritize right now are link clicks by destination, dynamic QR scan data, engagement depth (saves and watch time over likes), follower deltas, and layered conversion attribution. Each maps to a different content goal:
- Discovery posts: reach, profile visits, and click-through rate on your featured link
- Trust posts: saves, comments, watch time, and repeat visits
- Revenue/action posts: link clicks to product pages, promo code redemptions, and pixel-confirmed purchases
GA4 defines an engaged session as one lasting over 10 seconds, containing a key event, or including at least two page views. That threshold matters because a click that bounces in three seconds tells you nothing about intent. Lflow's real-time analytics surface click and scan data the moment it happens, so you can act on momentum rather than wait for a weekly export. The principle behind all of this: match the metric to the post's job, not to what the platform dashboard shows by default.
Table of Contents
- What are the main types of analytics for creators?
- How to set up link-in-bio tracking that actually shows outcomes
- Why dynamic QR codes give you scan-level reach data
- How to read engagement depth and follower deltas as trust signals
- Attributing conversions from creator traffic
- Real-time vs historical reporting: what to check and when
- Quick setup checklist: link, QR, and conversion tracking in under an hour
- What to track first, based on your creator goal
- Key Takeaways
- The analytics habit that actually changes what you do
- Lflow gives you real-time link and QR analytics in one place
- Useful sources
What are the main types of analytics for creators?
Creator analytics fall into three functional groups: discovery metrics (how people find you), trust metrics (how they engage), and revenue metrics (what they do after clicking). The table below maps each type to what it measures and where the data lives.
| Analytics type | What it measures | Where it lives |
|---|---|---|
| Link/short-link clicks | Total clicks, clicks by destination, traffic source | Link-in-bio platform, URL shortener |
| Click distribution | Share of clicks per link across your bio page | Link-in-bio dashboard |
| Click-through rate (CTR) | Clicks ÷ impressions on a featured link | Platform Insights, link tool |
| Conversion outcomes | Signups, purchases, downloads after a click | GA4, pixel dashboard |
| Dynamic QR scan analytics | Scan count, timestamp, device, country | QR platform (e.g., Lflow) |
| Engagement tiers | Likes, saves, comments, watch time, DMs | Native platform Insights |
| Follower deltas | New followers and unfollows over time | Platform or third-party tracker |
| Pixel/CAPI event tracking | Product views, add-to-cart, purchase funnel | Meta Events Manager, GA4 |
On-platform metrics (likes, follower counts) are the easiest to read but the least actionable for revenue. Off-platform metrics, meaning what happens after someone taps your link, require UTMs and destination analytics to capture. That gap between the tap and the outcome is where most creators lose the signal.

How to set up link-in-bio tracking that actually shows outcomes
Total clicks are a starting point, not an answer. The real question is which destination got clicked, from which platform, and whether that visitor converted. The most-clicked link in your bio isn't always the most valuable one — compare top-clicked destinations against downstream conversion rates to find where attention leaks.
A UTM string you can copy and adapt:
?utm_source=instagram&utm_medium=bio&utm_campaign=spring-drop&utm_content=link1
Keep naming consistent across every post. Mixing "IG" and "instagram" as source values splits your data into two rows in GA4, making monthly comparisons unreliable. Consistent UTM naming is what makes cross-platform comparisons possible.
Essential link-tracking setup:
- Create a unique short link for each placement (bio, pinned comment, story swipe-up)
- Apply the UTM template above to every destination link
- Connect conversion goals in GA4 (form submit, purchase, download)
- Enable CSV export from your link platform for monthly audits
- Schedule a monthly review comparing click volume to conversion rate per link
Pro Tip: Audit your link funnel monthly. Sort links by clicks, then by conversions. Any link with high clicks and near-zero conversions is an attention leak worth fixing — either the destination page is weak or the audience intent doesn't match the offer.
Why dynamic QR codes give you scan-level reach data
Dynamic QR codes log every scan in real time: total scans, timestamps, device type, operating system, and country. You can also change the destination without reprinting, which matters for any physical placement like a poster, merch tag, or event flyer.
Scan attributes you should expect to see in a QR dashboard:
- Total scans and unique scans
- Scan timestamps (useful for spotting campaign momentum by hour or day)
- Device and OS breakdown (iOS vs Android)
- Country and city-level data
- Referrer when available
Scan data alone shows reach. It tells you the code was scanned but not what happened next. Pair each QR code with a UTM-tagged short link so the scan carries through into GA4 or your conversion dashboard. That two-layer setup gives you both reach (from the QR platform) and outcome (from the destination analytics). Lflow's free QR code generator creates dynamic codes tied directly to your link-in-bio, so scan data and click data appear in the same dashboard.
For physical placements like QR codes on digital signage, the dynamic vs static decision is permanent. Once a static code is printed, you cannot retrofit scan-level analytics unless it points to a trackable short link. See the static vs dynamic QR breakdown for the full comparison.
Pro Tip: Always use dynamic QR for anything printed. If you're stuck with a static code, point it at a short link you control so you at least capture click data at the redirect layer.
How to read engagement depth and follower deltas as trust signals
Likes are the shallowest engagement signal. Saves, comments, watch time, and DMs sit progressively deeper on the trust scale, and repeat visits are the strongest signal of all. For discovery posts, a high like count with low saves is fine. For trust posts, low saves relative to views is a warning.
Engagement depth by signal strength:
- Shallow: likes, views, impressions
- Medium: comments, shares, profile visits after a post
- Deep: saves, watch time above 50%, DMs, repeat link clicks
- Strongest: direct messages asking about a product, repeat bio visits
Follower-delta tracking means watching new followers and unfollows over time, not just the total count. A spike in new followers after a post followed by a wave of unfollows a week later signals you attracted the wrong audience. Scheduled daily follower-change tracking with timeline history lets you distinguish genuine growth from churn. A practical cadence: check follower delta daily (30 seconds), review engagement summary weekly, and do a full post-to-follower-quality audit monthly.
Attributing conversions from creator traffic
Layered attribution reduces blind spots. Link tracking shows where a click originated. Promo codes capture conversions that happened after someone remembered your content but didn't click a tracked link. Pixel and CAPI events capture on-site funnel actions like product views, add-to-cart, and purchase.
| Attribution layer | Strength | Limitation |
|---|---|---|
| UTM/short-link tracking | Shows click origin and source | Loses the user after the click if no on-site tracking |
| Promo/discount codes | Captures remembered conversions | No click-path data; can be shared or leaked |
| Pixel/CAPI event tracking | Full funnel visibility on-site | Requires destination access; affected by ad blockers |
Implementation steps:
- Add UTMs to every outbound link using the template above
- Generate a unique promo code per campaign or platform
- Install Meta Pixel or GA4 event tracking on your destination page
- Test pixel fires on key events: product view, add-to-cart, purchase
Pro Tip: Reconcile conversions weekly in a single CSV. Match short-link click counts to promo redemptions and pixel events. When the numbers diverge, you've found a tracking gap, not a performance problem.
Real-time vs historical reporting: what to check and when
Real-time data is for launch QA and momentum checks. Historical data is for decisions.
- Real-time (first 2 hours after posting): total clicks, scan count, failed redirects, live follower delta
- Daily: new followers, top-clicked links, campaign CTR
- Weekly: conversion rate per link, engagement rate by post type, follower churn
- Monthly: revenue per visitor, top-performing UTM campaigns, link audit
Pro Tip: Cap each dashboard at 4–6 KPIs. More than that and you're reading data, not making decisions. Pick the metrics that directly answer "is this working?" for your current goal.
Quick setup checklist: link, QR, and conversion tracking in under an hour
You can get meaningful link, QR, and conversion tracking running in under an hour with this sequence:
- Create a unique short link for each placement (bio, story, pinned comment)
- Apply UTMs:
?utm_source=[platform]&utm_medium=[placement]&utm_campaign=[campaign-name] - Generate a dynamic QR code pointing to your UTM-tagged short link
- Install GA4 or Meta Pixel on your destination page if you control it
- Set up conversion goals in GA4 (purchase, signup, download)
- Test every link and QR code; record a test conversion event
- Enable CSV export from your link platform; schedule a weekly audit
Testing checklist before going live:
- Redirects resolve correctly on mobile and desktop
- UTM parameters appear in GA4 real-time reports
- Pixel fires on test events in Meta Events Manager
- QR scan registers in your QR dashboard
- CSV export contains clicks, source, and timestamp fields
What to track first, based on your creator goal
Start with the fewest metrics that answer your current question. Add more once the core signals stabilize.
Discovery goal:
- Reach and profile visits (daily check)
- CTR on your featured bio link (weekly)
- Top traffic source in your link dashboard (monthly)
Trust goal:
- Save rate and comment rate per post (weekly)
- Watch time or retention percentage for video (weekly)
- Follower delta after key posts (daily)
Revenue goal:
- Link clicks to product destination (daily during campaigns)
- Conversion rate per link (weekly)
- Promo code redemptions matched to UTM source (weekly)
For understanding which content drives real engagement, start with saves and watch time before adding conversion layers. Those two signals tell you whether your audience trusts you enough to act.
Key Takeaways
Matching each metric to the post's intended goal, not the platform default, is the single most important habit in creator analytics.
| Point | Details |
|---|---|
| Match metric to post goal | Use reach for discovery, saves/watch time for trust, clicks and conversions for revenue posts. |
| Use layered attribution | Combine UTM links, promo codes, and pixel/CAPI to cover every conversion blind spot. |
| Dynamic QR plus UTMs | Pair QR scan data with UTM-tagged destinations to see both reach and outcome in one view. |
| Track follower deltas | Monitor new followers and unfollows over time to distinguish real growth from churn. |
| Keep dashboards lean | Limit each reporting cadence to 4–6 KPIs; export CSV monthly for deeper audits. |
| Lflow for quick setup | Lflow provides real-time click and scan analytics, free dynamic QR codes, and CSV export from a single link-in-bio dashboard. |
The analytics habit that actually changes what you do
Most creators check their numbers and feel something — proud, anxious, confused — then close the tab and post the same way they always have. The data didn't change anything because there was no decision attached to it.
The shift happens when you tie a specific metric to a specific question. Not "how did this post do?" but "did this post move people to my product page, and if not, where did they drop off?" That framing turns a dashboard into a diagnostic tool.
The weekly habit worth building: spend 10 minutes every Monday reviewing your link-in-bio funnel. Which source sent the most visitors last week? Which link got the most clicks? Which link converted? If the top-clicked link has the lowest conversion rate, the problem is either the destination page or the audience mismatch. That's a fixable problem. You can't fix what you haven't named.
One more thing worth saying plainly: follower count is the metric brands ask about and the metric that matters least for revenue. A creator with 8,000 followers and a 4% link CTR will outperform one with 80,000 followers and a 0.3% CTR every time. The social media stats that actually matter for marketing are the ones downstream of the follow, not the follow itself.
Lflow gives you real-time link and QR analytics in one place
Creators who want the setup checklist above running fast without stitching together five tools get it all in Lflow. You get unlimited links, free dynamic QR codes with scan analytics, real-time click data by destination and source, and CSV export for monthly audits — all from a single link-in-bio page that takes under two minutes to set up.
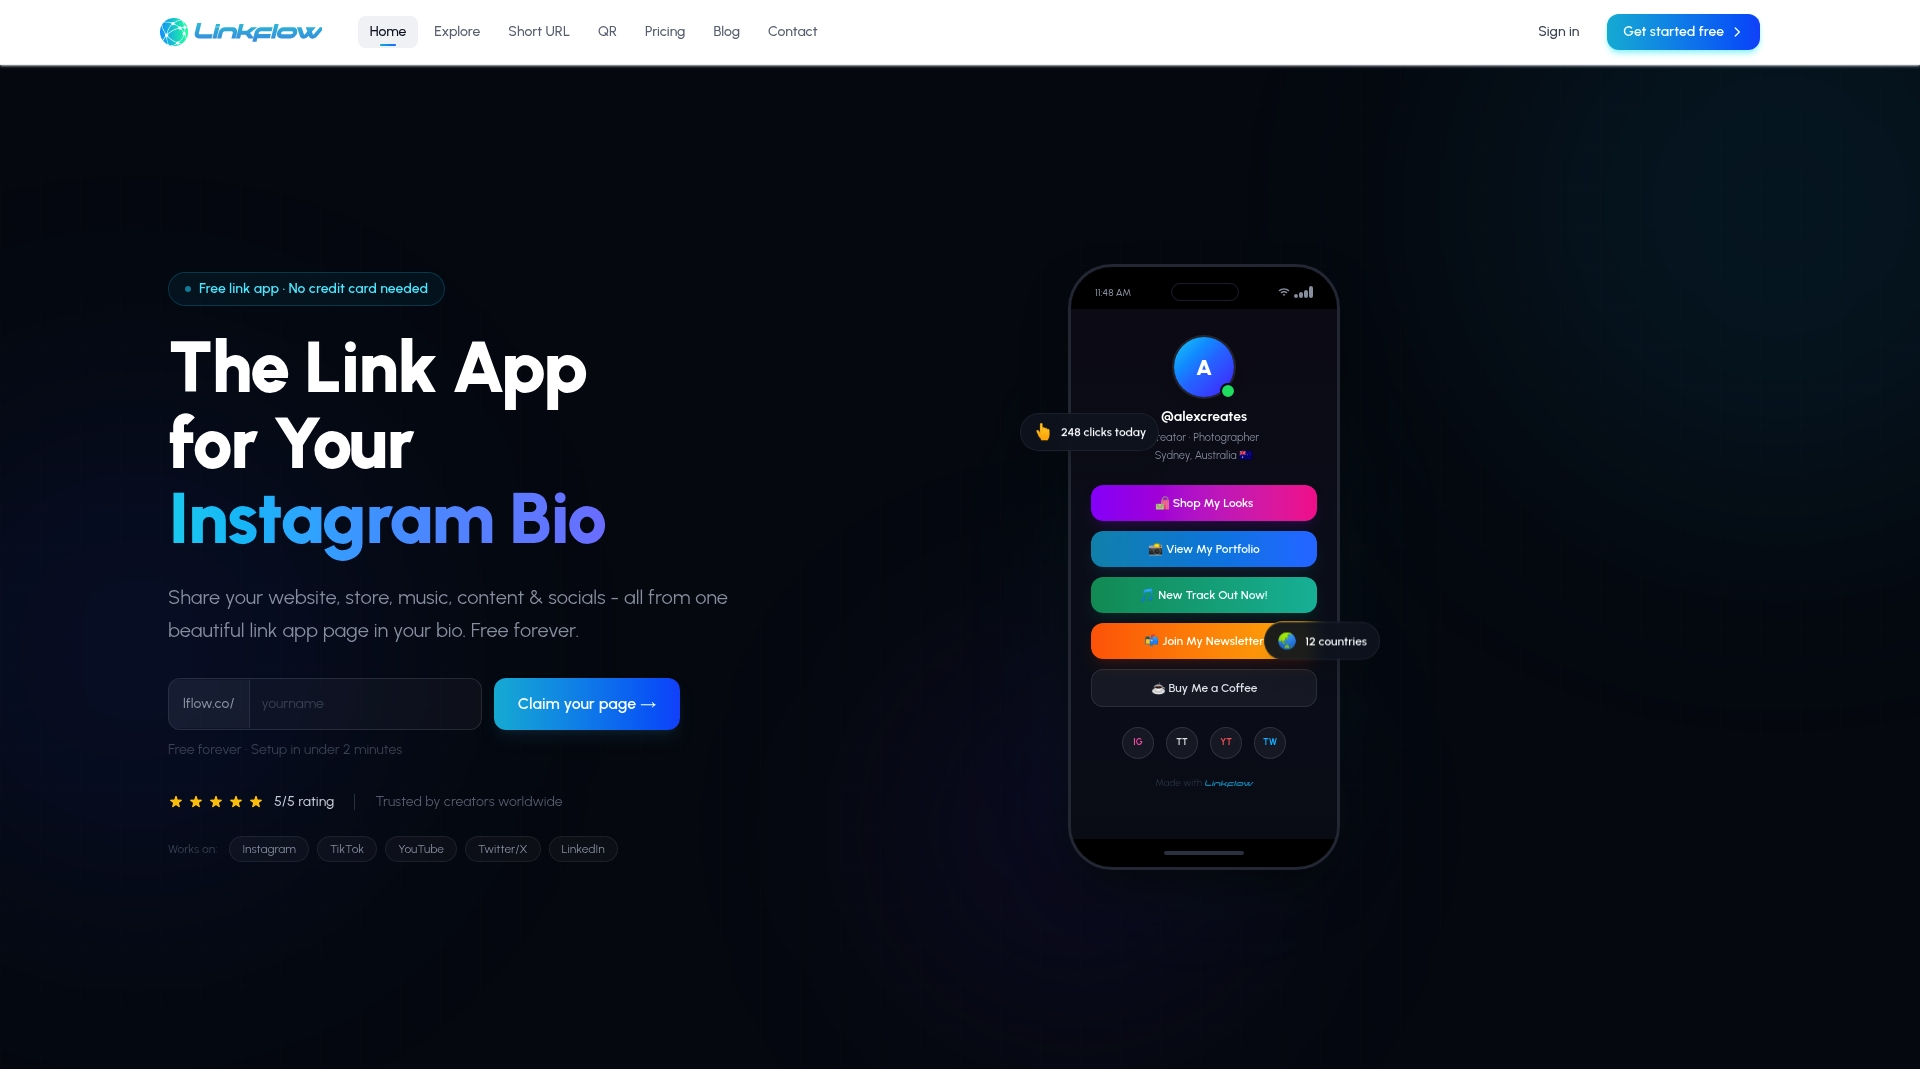
The free plan covers the core tracking most creators need: clicks, scans, traffic sources, and link distribution. Paid plans add custom domains, advanced analytics, and branded short links for creators running multi-platform campaigns. Start with a free link-in-bio page or go straight to the QR code generator if QR tracking is your immediate priority.
Useful sources
- How do creators know what content is working? — best starting point for goal-based metric selection and GA4 engaged session definition
- Link-in-Bio Analytics: Monthly Metrics for Creators — detailed guide on link funnel auditing, UTM naming, and monthly review cadence
- How to Track QR Code Scans: The Analytics That Matter — explains the two-layer QR tracking approach (native scan data plus UTM destination tracking)
- QR Code Generator with Analytics — reference for dynamic QR scan attributes and real-time scan dashboards
- How to track influencer conversions — covers layered attribution (UTM, promo codes, pixel/CAPI) with implementation guidance
- InstaLens follower tracking — follower delta tracking with timeline history for Instagram
- Followerwonk follower tracker — daily follow/unfollow tracking with export for X/Twitter and Bluesky
- Static vs Dynamic QR Codes — Lflow's breakdown of when to use each type for creator campaigns
- What Is Link Tracking? — primer on link tracking concepts and UTM implementation for creators