

Real-time analytics is the practice of ingesting, processing, and querying data within milliseconds to low seconds of an event occurring, so teams act on what's happening now instead of reviewing a report tomorrow. The payoff is direct: fraud gets blocked mid-transaction, a dashboard reflects a spike as it happens, a pricing engine adjusts before the sale ends. "Real-time" isn't one fixed speed. It's a spectrum running from sub-100-millisecond automated triggers to low-second dashboard refreshes, and choosing an appropriate point on that spectrum is the key engineering challenge.
TL;DR:
- Durable ingestion systems like Kafka are critical, as dropping or out-of-order events produce inaccurate real-time answers.
- Prioritizing latency for fraud detection and responsiveness for user dashboards requires different system configurations, often under 100 milliseconds.
- Real-time analytics is most valuable in use cases needing immediate action, such as transaction fraud, live monitoring, and dynamic marketing adjustments.
- Common pitfalls include schema evolution issues, backpressure handling, and reliance on operational databases rather than columnar analytic stores for processing.
- Tools like Kafka, Flink, and columnar databases are best matched to specific pipeline stages, with emerging trends moving toward standard SQL and embedded machine learning.
Table of Contents
- How Real-Time Analytics Works: The Event-to-Action Pipeline
- What Are the Three Measurable Dimensions of Real-Time Data?
- Technology Stack and Common Tool Roles
- When Do You Actually Need Real-Time Analytics?
- Where Real-Time Analytics Creates Measurable Value
- What KPIs and Latency Targets Should You Set?
- Implementation Patterns and the Pitfalls That Sink Projects
- Architecture Checklist for Procurement and Design Reviews
- Security and Privacy Considerations in Real-Time Analytics
- Integration Challenges With Existing Data Infrastructure
- Tools and Frameworks Comparison for Implementing Real-Time Analytics
- Future Trends and Emerging Technologies in Real-Time Analytics
- Publisher Perspective: Link Tracking as a Real-Time Analytics Entry Point
- A Faster Way to Get Live Campaign Visibility
- Sources
How Real-Time Analytics Works: The Event-to-Action Pipeline
Every real-time system moves data through the same four stages, whether it's tracking fraud or link clicks. Understanding each one tells you where your architecture needs to invest and where you can cut corners.
- Event generation. Data originates from app events, clickstreams, IoT sensor readings, or change data capture (CDC) feeds pulling row-level changes out of an operational database. The event's timestamp gets set here, and that timestamp is what every downstream freshness metric will be measured against.
- Ingestion. Events land in a durable, ordered event bus, typically something like Apache Kafka, which decouples producers from consumers and lets you replay data if a downstream service fails. This durability layer is what separates real-time architecture from a fragile webhook chain that drops data the moment a consumer goes offline.
- Processing and enrichment. A stream processor transforms raw events, joins them against reference data, and computes rolling aggregates. Some workloads process continuously as data arrives; others compute on demand when a query fires, a distinction that shapes both cost and latency.
- Storage and query. The processed data lands in a store built to serve queries the instant rows are written, often using insert-time transforms or materialized views so a dashboard never has to scan raw history to answer a question.
Get the first two stages wrong and nothing downstream matters. A system that ingests events out of order or drops them under load will produce fast answers that are simply incorrect.
What Are the Three Measurable Dimensions of Real-Time Data?
Freshness, latency, and concurrency are the three dimensions that actually determine whether a system qualifies as real-time, and Databricks frames the challenge as balancing all three against a given workload rather than maximizing any one of them.
- Freshness measures event age: how old is the data being queried, tracked as an average and, more usefully, as a worst-case sample.
- Latency measures response time, and the number that matters is rarely the median. Track p95 and p99 tail latency, since a system that answers most queries in 100 milliseconds but stalls to 4 seconds on the 99th percentile will still frustrate users during peak load.
- Concurrency measures how many simultaneous queries or dashboard sessions the system serves without degrading the other two dimensions.
By the numbers: Tinybird's engineering guidance puts the ceiling for user-facing dashboard refreshes at roughly 500 milliseconds. Beyond this threshold, perceived responsiveness tends to drop noticeably, even when the underlying data remains accurate.
Prioritize based on what breaks first: a fraud engine often prioritizes latency, a public dashboard emphasizes concurrency, and a compliance report focuses on freshness.
Technology Stack and Common Tool Roles
Four categories of tooling map onto the pipeline stages above, and knowing which category solves which problem keeps you from overbuying.
- Streaming platforms like Apache Kafka or Amazon Kinesis handle durable, high-throughput ingestion, often paired with CDC connectors that stream row-level changes out of Postgres, MySQL, or similar operational databases.
- Stream processors and streaming SQL engines, including Apache Flink, Spark Structured Streaming, and ksqlDB, handle the transformation and enrichment layer, letting engineers write continuous queries instead of batch jobs.
- Real-time analytical stores are purpose-built, columnar databases such as ClickHouse that index data on insert rather than requiring a separate indexing pass. Columnar storage matters here because analytical queries typically scan a handful of columns across millions of rows, and a row-oriented database forces it to read data it doesn't need.
- Connectors and integration layers determine how much custom glue code you write. Broad connector support for common sources (Salesforce, Postgres, S3, application SDKs) is often the difference between a two-week integration and a two-month one.
Retention policy sits underneath all of it: raw event streams get expensive to keep indefinitely, so most production systems tier data, keeping recent events hot and rolling older data into cheaper cold storage or pre-aggregated summaries.
When Do You Actually Need Real-Time Analytics?
Not every dashboard needs sub-second freshness, and building for it when you don't need it just inflates cost and complexity. Run through this checklist before committing:
- Does an automated action depend on the data? If a system needs to block a transaction, throttle a service, or trigger an alert without a human in the loop, you need continuous processing, not a nightly batch job.
- What do users actually expect? A live sports score needs sub-second updates. A monthly revenue report does not, no matter how much stakeholders like the word "real-time" in a pitch deck.
- What does delay cost you? Fraud detection often runs on millisecond thresholds because a delayed decision means the fraudulent transaction already cleared. A marketing dashboard tolerating a few seconds of lag costs nothing measurable.
Hybrid architectures, where a subset of high-value events stream continuously while the bulk of historical analysis runs in batch, are often the right answer. Full real-time everywhere is rarely worth what it costs.
Where Real-Time Analytics Creates Measurable Value
The use cases below share one trait: a human or automated system needs to act inside a window measured in seconds, not the next business day.
- Financial services. Transaction scoring models evaluate a payment as it's authorized, halting fraudulent charges before settlement rather than flagging them in an overnight report. This is a textbook case of the continuous, alerting-based approach that practitioners distinguish from simple on-demand querying.
- Retail and ecommerce. Personalization engines adjust product recommendations and dynamic pricing based on browsing behavior from the current session, not last week's purchase history.
- Observability and infrastructure monitoring. Live alerting on error rates, latency spikes, and resource saturation lets engineering teams intervene before an incident becomes an outage. This shift from reactive firefighting to proactive monitoring is one of the clearest returns on real-time investment.
- IoT and manufacturing. Streaming telemetry from equipment sensors enables preemptive maintenance, catching vibration or temperature anomalies before a machine fails on the line.
- Marketing and campaign management. Live click tracking on links and QR codes tells a team within the campaign's first hour whether a launch is working, informing budget reallocation while the campaign is still live rather than after the spend is gone. This kind of analytics-driven marketing decision-making is increasingly what separates campaigns that adjust mid-flight from ones that just report results afterward.
Each of these cases justifies real-time infrastructure because the cost of a delayed decision is concrete: a fraudulent charge, a missed sale, an outage, a failed part, a wasted ad budget.
What KPIs and Latency Targets Should You Set?
Set numeric targets before you build, not after a vendor demo impresses someone in a review meeting. The KPIs that matter are freshness (event age at query time), median latency, tail latency at p95 and p99, and ingestion throughput measured in events per second.
- Aim for around 100 milliseconds for automated decision systems like fraud scoring, where the action happens without a human reading the result.
- Target sub-second response for user-facing dashboards, consistent with the roughly 500-millisecond threshold Tinybird identifies as where perceived responsiveness starts to degrade.
- Test with synthetic event generators that simulate peak load before launch, not after, and monitor ingestion lag, query queue depth, and error rates continuously once live.
Statistic to remember: dashboards refreshing slower than roughly 500 milliseconds see a measurable drop in user engagement, according to Tinybird's field data, making sub-second query performance a functional requirement rather than a nice-to-have for anything users watch live.
Implementation Patterns and the Pitfalls That Sink Projects
Most real-time projects don't fail because the streaming platform is slow. They fail because of edge cases nobody planned for during the design phase.
- Out-of-order and late-arriving events need watermarks to define how long a processor waits for stragglers before finalizing a window, paired with idempotent writes so a replayed event doesn't get double-counted.
- Schema evolution breaks pipelines silently when an upstream team adds or renames a field. Validate schemas at the ingestion boundary rather than discovering the break three stages downstream.
- Using a transactional database for analytical workloads is one of the most common and expensive mistakes teams make. Row-oriented operational databases choke under high-cardinality analytical queries that a columnar store handles natively.
- Backpressure needs explicit handling. When a downstream consumer slows down, the system needs a defined behavior (buffer, drop, or throttle) rather than an undefined one that surfaces as a mystery outage six months later.
- Run periodic chaos tests, killing a consumer or delaying a partition on purpose, to confirm the pipeline recovers cleanly instead of assuming it.
Pro Tip: Before building the full pipeline, validate the design with lightweight sampling. Process 1% of events through a scaled-down version of the stack, confirm freshness and latency hold up, then scale volume once the pattern is proven. It's far cheaper to catch a watermarking bug at 1% scale than after the fraud model is live.
Architecture Checklist for Procurement and Design Reviews
Bring this list into any vendor evaluation or internal architecture review, because it's the difference between a system that scales and one that gets rebuilt in eighteen months.
- Connector breadth: native support for the databases, SaaS tools, and event sources you actually run, not just the popular ones in a demo.
- Managed vs. self-hosted options: a managed streaming platform reduces operational burden but constrains some tuning; weigh that against your team's operational capacity.
- SQL compatibility: streaming SQL support (ksqlDB-style syntax) lowers the barrier for analysts who don't write Java or Scala.
- Retention controls: the ability to tier hot and cold storage independently keeps costs predictable as event volume grows.
- Governance: data lineage tracking, field-level access controls, and clearly defined consistency guarantees, since "eventually consistent" means something different to every vendor.
Cost control mostly comes down to two levers: shrinking retention windows on raw event data, and separating compute from storage so you scale each independently, a pattern ClickHouse's engineering team treats as foundational to production-ready systems rather than an optimization to bolt on later.
Security and Privacy Considerations in Real-Time Analytics
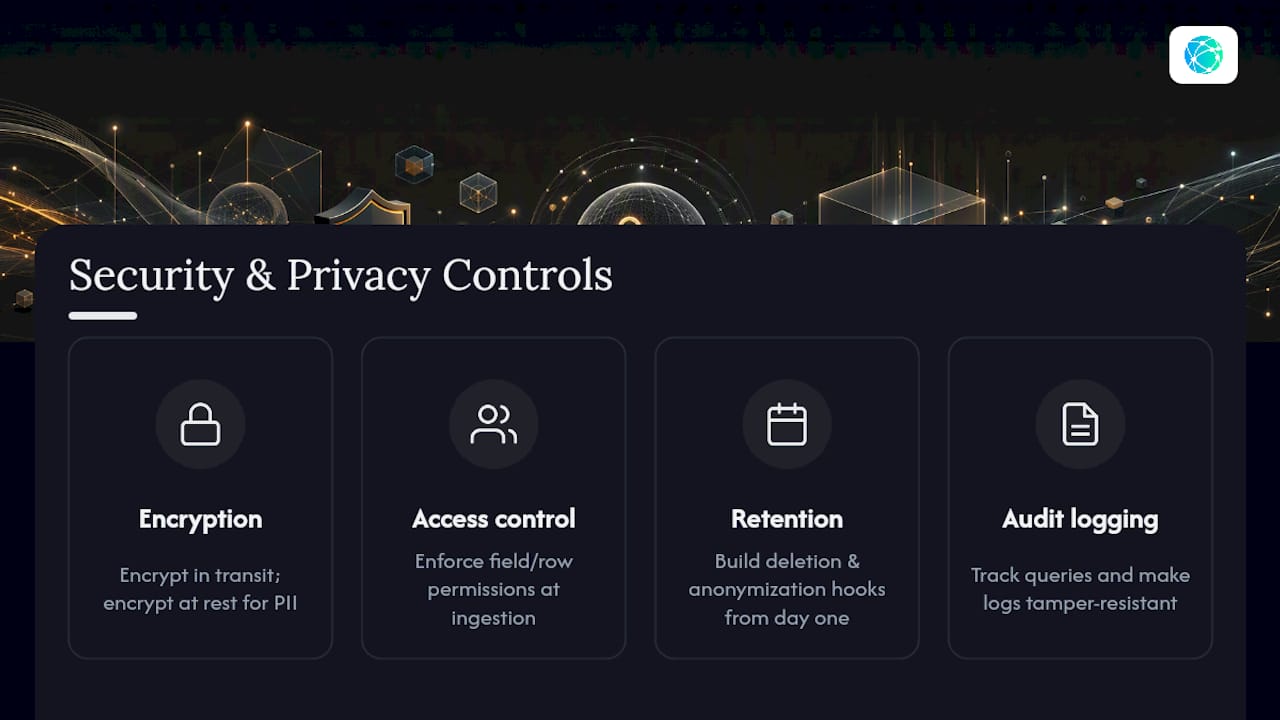
Streaming architectures introduce a security surface that batch systems don't have: data in motion, not just data at rest. Every event bus, stream processor, and analytical store in the pipeline needs encryption in transit, and most production deployments encrypt data at rest in the analytical store as well, particularly when personal identifiers ride along with clickstream or transaction events.
Access control gets harder in a streaming context because data reaches its destination faster than a manual review process can catch a misconfiguration. Field-level and row-level permissions need to be enforced at the point of ingestion or enrichment, not bolted on afterward at the dashboard layer, or a analyst with broad query access could see personally identifiable information that a compliance policy never intended to expose it.
Retention policy is a privacy control as much as a cost control. Regulations like GDPR and CCPA impose deletion obligations, and a streaming pipeline that fans event data out to five different downstream stores makes a deletion request exponentially harder to honor than a single well-governed data warehouse would. Building deletion and anonymization hooks into the pipeline from day one, rather than retrofitting them once a request arrives, saves teams from scrambling later.
Audit logging matters more here than in batch systems, since a security incident in a real-time pipeline can propagate to downstream consumers within seconds. Track who queried what, when, and through which service, and make sure that log itself is tamper-resistant.
Integration Challenges With Existing Data Infrastructure
Almost no organization builds a real-time pipeline on a blank slate. Most are retrofitting streaming capability onto a data warehouse, a handful of operational databases, and a set of legacy batch ETL jobs that have run unchanged for years, and that mismatch is where most integration timelines blow their estimates.
Change data capture is usually the bridge, streaming row-level changes out of an operational database without requiring an application rewrite. But CDC has sharp edges: it depends on the source database's transaction log format, and a schema migration on the source side can silently break the CDC feed if nobody coordinates the change across teams.
Legacy batch jobs create a second friction point. Many organizations run real-time and batch pipelines in parallel for months, reconciling the two to confirm the streaming numbers match the trusted batch reports before decommissioning anything. That reconciliation period is not wasted time. It's often the only way to catch a subtle bug in the streaming logic before it corrupts a decision that matters.
Network and firewall topology matters more than most teams expect going in. Streaming platforms often need persistent connections and specific port ranges that a traditional data center's security policy wasn't designed around, which means the integration project frequently touches the network team's roadmap as much as the data team's.
Tools and Frameworks Comparison for Implementing Real-Time Analytics
The right combination of tools depends on where your bottleneck actually is, not on which stack has the most attention this year.
For ingestion, Apache Kafka remains the default choice for teams that need a durable, replayable event log with a mature ecosystem of connectors. Managed alternatives like Amazon Kinesis reduce operational overhead at the cost of some flexibility in partition tuning and retention configuration.
For processing, Apache Flink handles complex event-time semantics and stateful processing well, which makes it a common choice for workloads with strict ordering and windowing requirements. Spark Structured Streaming appeals to teams that already run Spark for batch workloads and want one processing engine instead of two. ksqlDB trades some of that power for accessibility, letting teams express streaming transformations in SQL instead of a general-purpose programming language.
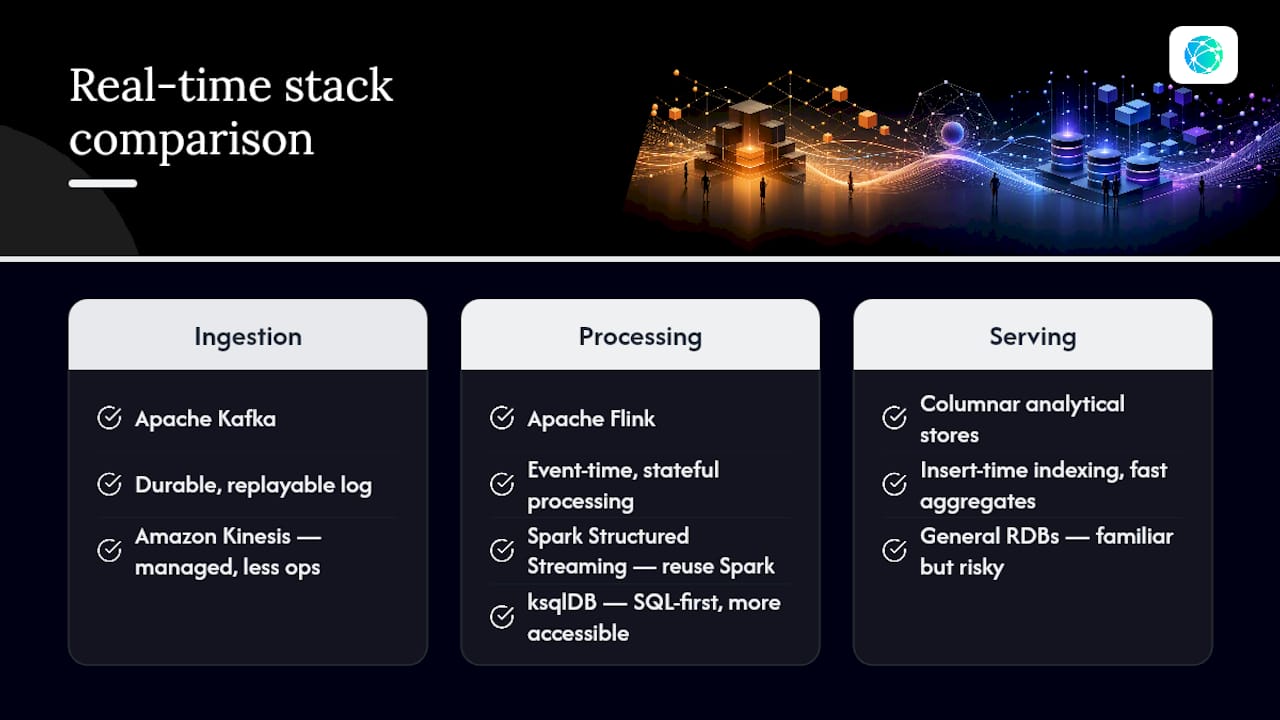
For the serving layer, columnar analytical stores built for insert-time indexing outperform general-purpose databases on the exact query pattern real-time dashboards generate: aggregations over a narrow set of columns across a large and constantly growing row count. Choosing a general-purpose relational database here because the team already knows it well is the single most common source of the performance problems that show up six months after launch.
Future Trends and Emerging Technologies in Real-Time Analytics
Streaming SQL is converging toward something closer to standard SQL, lowering the skill barrier that used to gate real-time work behind a small number of specialized engineers. Expect that trend to keep accelerating as more analysts, not just data engineers, start writing continuous queries directly.
Real-time machine learning inference embedded directly in the stream is moving from novelty to standard practice, particularly in fraud detection, where scoring a transaction as it flows through the pipeline is now table stakes rather than a differentiator. Expect more analytical stores to bundle lightweight inference capability natively rather than requiring a separate model-serving layer bolted onto the side.
Edge processing is pushing part of the pipeline closer to where events originate, particularly for IoT and manufacturing telemetry, reducing the volume of raw data that needs to travel to a central store before a decision can be made. That shift trades some centralized visibility for lower latency on the decisions that matter most at the source.
Separation of compute and storage, already a defining feature of modern analytical stores, is likely to deepen further as cloud providers compete on granular, usage-based pricing for each layer independently. That gives smaller teams access to real-time infrastructure that used to require a dedicated platform engineering group to run.
Publisher Perspective: Link Tracking as a Real-Time Analytics Entry Point
Enterprise streaming stacks solve a genuinely different problem than most marketing teams have. A brand tracking a product launch usually needs one thing: to know within a second whether a link or QR scan is converting, not to build a Kafka cluster. Redirect-based link tracking already runs the same event-to-query pipeline described above, just scoped to one use case, which is why it's a sensible place to start before justifying a full streaming investment. Teams should build the bigger architecture when they need automated, cross-system actions. They should start with a focused tracker when the job is campaign visibility.
— Axion
A Faster Way to Get Live Campaign Visibility
Building a Kafka-based pipeline to know whether last night's Instagram post is converting is solving the wrong problem with the wrong tool. Lflow gives creators and marketing teams the practical slice of real-time analytics they actually need: instant link click analytics and QR scan data the moment someone taps, without provisioning a single stream processor.
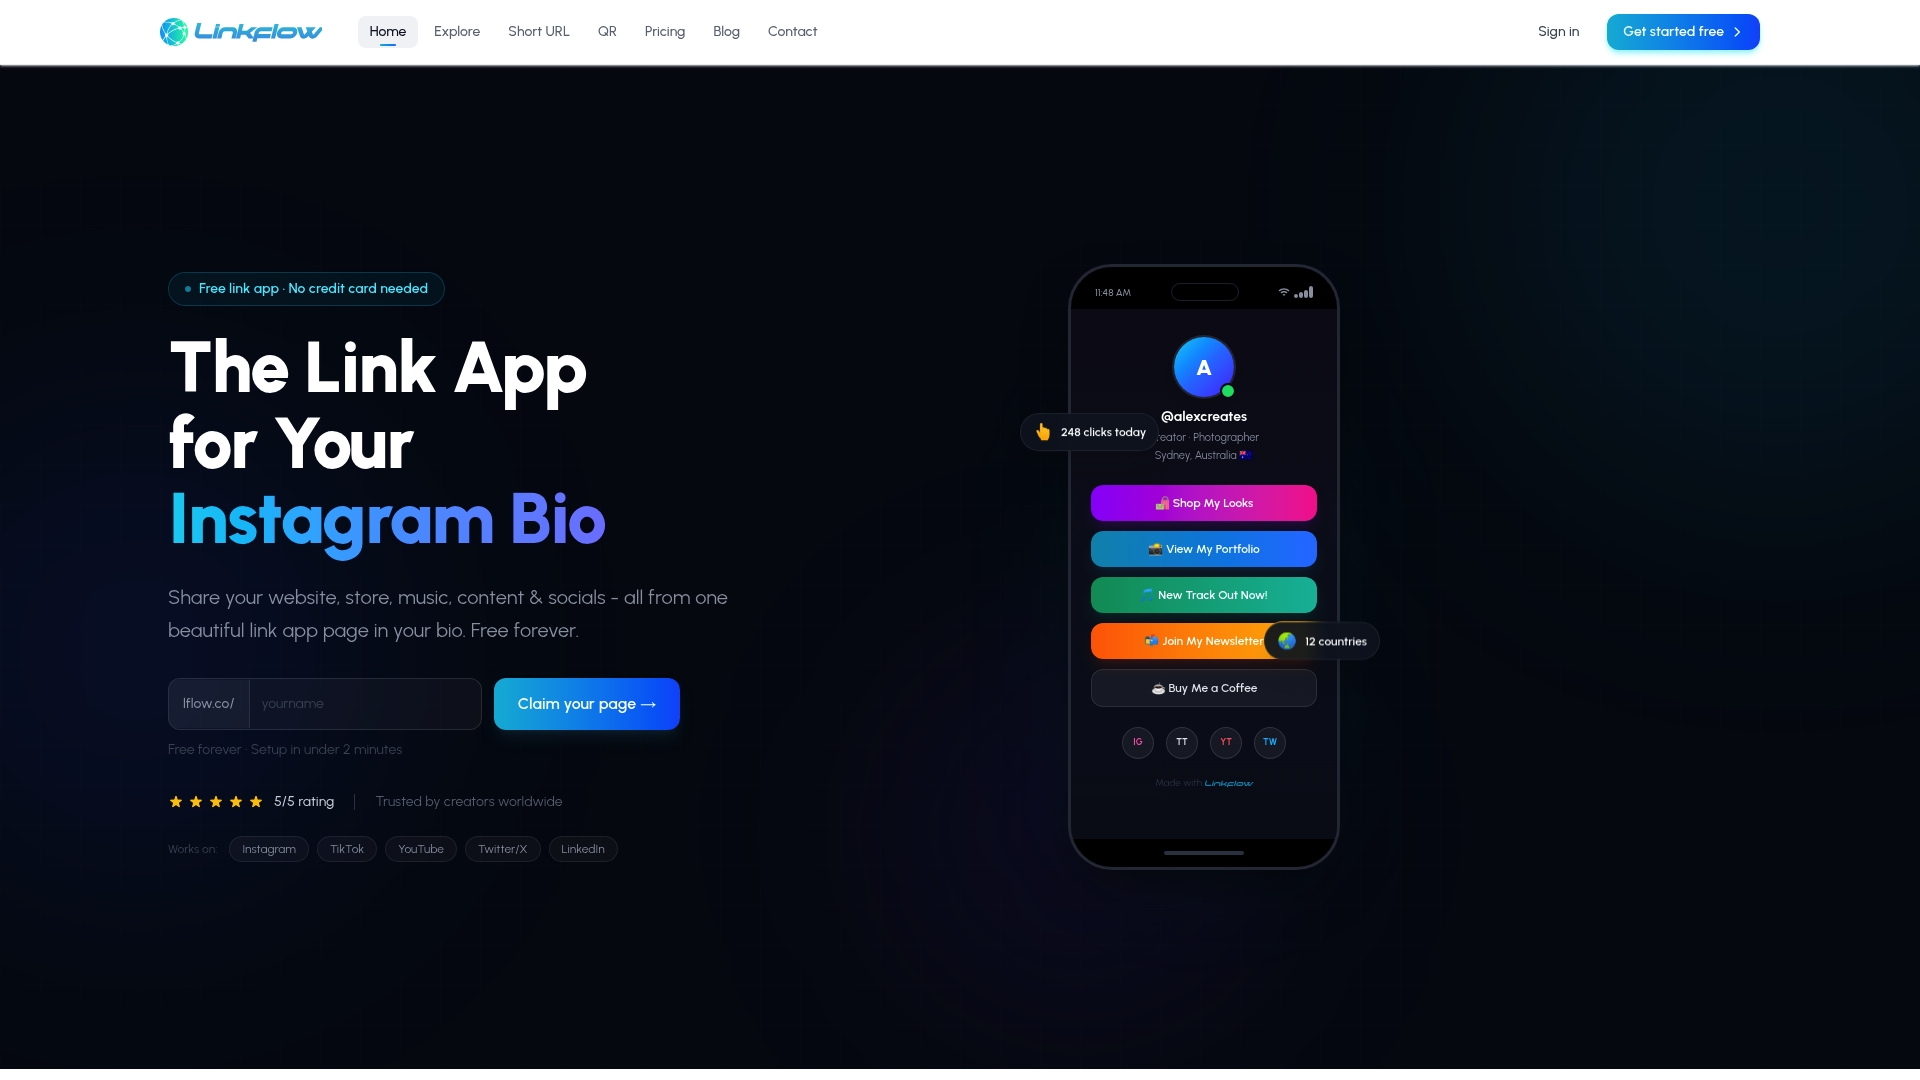
If you're running a product launch, a music drop, or a multi-platform campaign and need to see which link is working right now, not in next week's report, Lflow's free link-in-bio page gives you that visibility out of the box, along with QR codes for offline promotion and exportable data when you need to share results. Set it up in under two minutes and start watching your live click data as it comes in.
Sources
- What is Real-Time Analytics? — ClickHouse engineering
- What is real time analytics? — Databricks
- What real-time data analytics really means — SigmaComputing blog
- Real-time analytics: a definitive guide — Tinybird
- Apache Kafka