

Getting your link-in-bio click and QR scan data into Google Sheets comes down to four workable methods: CSV export, a Sheets connector or add-on, Apps Script with an API, or no-code automation through tools like n8n or Zapier. For most creators, the fastest starting point is exporting a CSV, dropping it in Google Drive, and letting a scheduled parser append the rows automatically. This is strictly about link-in-bio analytics, meaning your page clicks, referrers, and QR scans, not Google Analytics or Search Console data. Some link-in-bio platforms support CSV exports directly from their dashboards, so you can start today.
TL;DR:
- Using CSV exports is suitable for weekly or monthly reports with low to moderate data volume, but requires manual effort each time.
- Connectors and add-ons enable scheduled data pulls, offering automation but often limited to summary metrics and prone to rate limits or token expirations.
- Apps Script, APIs, and webhooks provide real-time or near-real-time data syncing, demanding technical setup but offering the most control and reliability.
- No-code tools like n8n, Zapier, or Make serve as middle-ground solutions, automatically appending CSV files or API data without coding experience.
- For accurate and manageable dashboards, structure data into separate raw, cleaned, metrics, and chart tabs, and restrict access to raw data with proper retention policies.
Table of Contents
- Which Method Fits Your Reporting Needs?
- Method A: CSV Export and Import for Weekly Reports
- Method B: Sheets Add-ons and Connectors for Scheduled Pulls
- Method C: Apps Script, API, and Webhooks for a Reliable Sync
- Method D: No-Code Automation With n8n, Zapier, or Make
- Building a Sheet and Dashboard That Actually Works
- What to Leave Out, and How to Verify Your Import
- A Note From Axion on Lflow Exports and a Starter Workflow
- When to Automate Now vs. Start Manual
- Try Lflow's Free Plan for Exportable Click and QR Data
- Sources
- FAQ
Which Method Fits Your Reporting Needs?
Your choice depends on three things: how often you report, whether you have any technical help, and how much data you're moving. A creator posting a monthly recap needs something different than a brand agency pulling hourly campaign numbers.
- CSV export: Free, zero setup, but fully manual. Best for weekly or monthly reports with modest volume.
- Sheets add-on/connector: Scheduled refreshes without code, but often limited to summary metrics rather than raw click-level fields, as Porter Metrics tutorials show for similar platforms.
- Apps Script/API: Full control over fields and near-real-time updates, but requires basic scripting knowledge and API credentials.
- No-code automation (n8n, Zapier, Make): Scheduled or event-driven syncing without writing code, ideal once you outgrow manual CSV handling.
If you need hourly or real-time ingest, only Apps Script/API or webhook-driven no-code flows will get you there. Everything else runs on a schedule you set manually.
Method A: CSV Export and Import for Weekly Reports
This is the manual workhorse, and it's the right place to start if you've never automated anything before.
- Open your link-in-bio dashboard (Lflow's analytics panel, for example) and locate the export option, usually under a reporting or analytics tab.
- Select the date range and confirm the export includes: timestamp, link slug, QR scan ID, referrer, UTM parameters, device type, and country.
- Download the CSV and open Google Sheets. Go to File > Import, upload the file, and choose "Replace current sheet," "Insert new sheet," or "Append to current sheet" depending on whether you're building a running history.
- Rename the tab something clear, like "Raw_Import_March," so historical files don't get overwritten by accident.
- Cross-check row counts against your dashboard's total click count to confirm nothing dropped during export, a step TheBricks recommends as a basic sanity check.
To automate the handoff without full API work, save exports to a synced Google Drive folder and use a no-code watcher to detect new files and append them, a pattern covered later in this guide.
Pro Tip: Keep one master "Raw Data" tab that only ever gets appended to, never overwritten. Build your dashboard formulas on a separate tab that references it, so a bad import never wipes your charts.
Method B: Sheets Add-ons and Connectors for Scheduled Pulls
Add-ons trade some flexibility for convenience. Once connected, they handle refreshes automatically, no manual export required.
The typical workflow: install the add-on from the Google Workspace Marketplace, authorize the connected account, choose your metrics (clicks, scans) and dimensions (date, link, campaign), then set a refresh schedule, usually hourly, daily, or weekly. Porter Metrics documents this exact flow for connecting social pages, and the pattern holds for most Sheets connectors regardless of platform.
- Metrics are the numbers (total clicks, total scans); dimensions are how you slice them (by date, by link, by referrer).
- Many connectors cap how many raw fields they expose. If you need granular referrer or device data and the add-on only returns totals, that's a sign to move to Apps Script or CSV.
- Rate limits are common on free tiers. If a scheduled pull fails silently, check the add-on's run history before assuming your data is wrong.
- Authorization tokens expire periodically. If a refresh suddenly stops populating rows, re-authorize the connected account first, before troubleshooting formulas.
Method C: Apps Script, API, and Webhooks for a Reliable Sync
This is the durable, scalable option. It takes more setup, but once built, it runs itself.
- Generate API credentials from your link-in-bio platform's developer settings.
- Map the endpoints you need, typically a clicks endpoint and a QR scans endpoint, and note which fields each returns.
- Write an Apps Script function that calls the API, parses the JSON response, and writes each field to its own column.
- Set a time-based trigger (hourly or daily) inside Apps Script, or configure a webhook endpoint if your platform pushes events instead of waiting to be pulled.
- For webhook-based syncing, append each event as a new row and use a unique event ID to avoid double-counting the same click twice, a common failure point in near-real-time systems.
Build in retry logic with exponential backoff for rate-limited requests, and never hardcode API keys directly in your script. Store them in Apps Script's Properties Service instead.
Pro Tip: Log every failed API call to a separate "Errors" tab with a timestamp. When something breaks at 2 a.m., you want a paper trail, not a guessing game.
Method D: No-Code Automation With n8n, Zapier, or Make
No-code tools sit between manual CSV work and full custom scripting. They're the fastest route to real automation if you don't have a developer on hand.
Three patterns cover almost every use case: a Drive watcher that detects a new CSV export and parses it into Sheets automatically, a scheduled API pull that transforms JSON into rows on a timer, and a webhook listener that appends events as they happen. Triggerall's n8n guide walks through building the Drive watcher pattern step by step, and it works well as a fallback when direct API access is restricted or requires approval you haven't gotten yet.
- Self-hosted n8n can run for minimal hosting cost, while Zapier and Make charge per task or run, which adds up fast at high volume.
- Test any new workflow with a small batch first. A malformed CSV can silently duplicate or skip rows if your parser isn't strict about column matching.
- If your platform doesn't offer an API, the CSV watcher becomes your permanent solution, not just a stopgap.
Building a Sheet and Dashboard That Actually Works
Structure beats cleverness here. Use four tabs: Raw Data (never edited by hand), Cleaned Data (formulas that standardize dates and remove duplicates), Metrics & Pivots (your calculation layer), and Dashboard (charts and summary tiles only).
QUERYhandles flexible filtering and sorting without touching your raw tab.SUMIFSandCOUNTIFSbuild daily or weekly totals by link or campaign.UNIQUEpulls a clean list of link slugs or referrers for dropdown filters.- PivotTables handle click-by-source and scan-by-campaign breakdowns fastest.
Track click-through rate by link, top referrers, QR scan volume by campaign, and device split. A line chart works for trends over time; a bar chart works better for comparing links side by side. Name your ranges and add a "Last Refreshed" cell so anyone opening the sheet knows how current the data is, a habit that keeps a dashboard template portable when you hand it off to a client or teammate.
What to Leave Out, and How to Verify Your Import
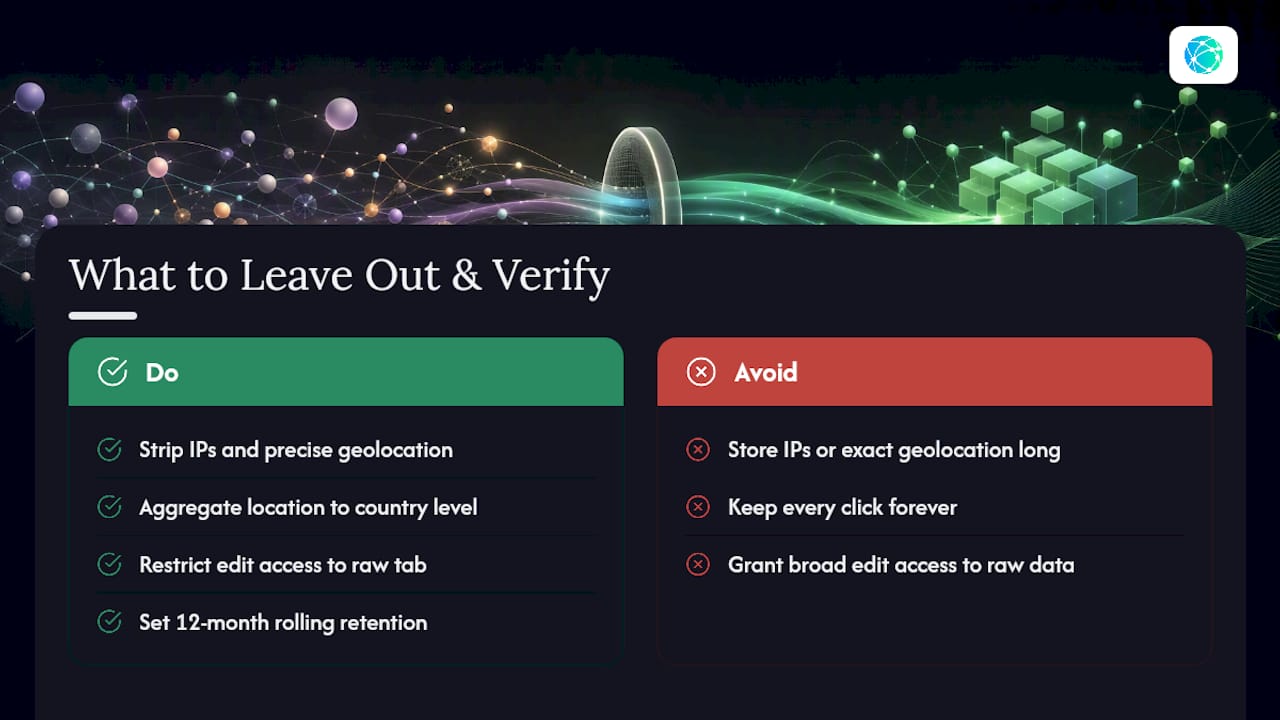
Raw click logs from link platforms often include IP addresses and precise geolocation, fields you generally don't need for reporting and shouldn't store longer than necessary, as Linkly's export documentation notes. Strip these during import or aggregate them to country level only.
Restrict edit access to your raw data tab, and set a retention window, say 12 months of rolling history, rather than keeping every click forever. To verify a sync worked, compare your Sheet's total row count against your dashboard's reported totals weekly, and spot-check five random rows against the original export for field accuracy.
A Note From Axion on Lflow Exports and a Starter Workflow
Axion covers analytics tooling for creators, and Lflow's own dashboard is a useful case study for how link-in-bio exports should work. Certain link-in-bio platform CSV exports include click timestamps, QR scan IDs, referrer data, and UTM parameters, matching the fields this guide recommends pulling into Sheets.
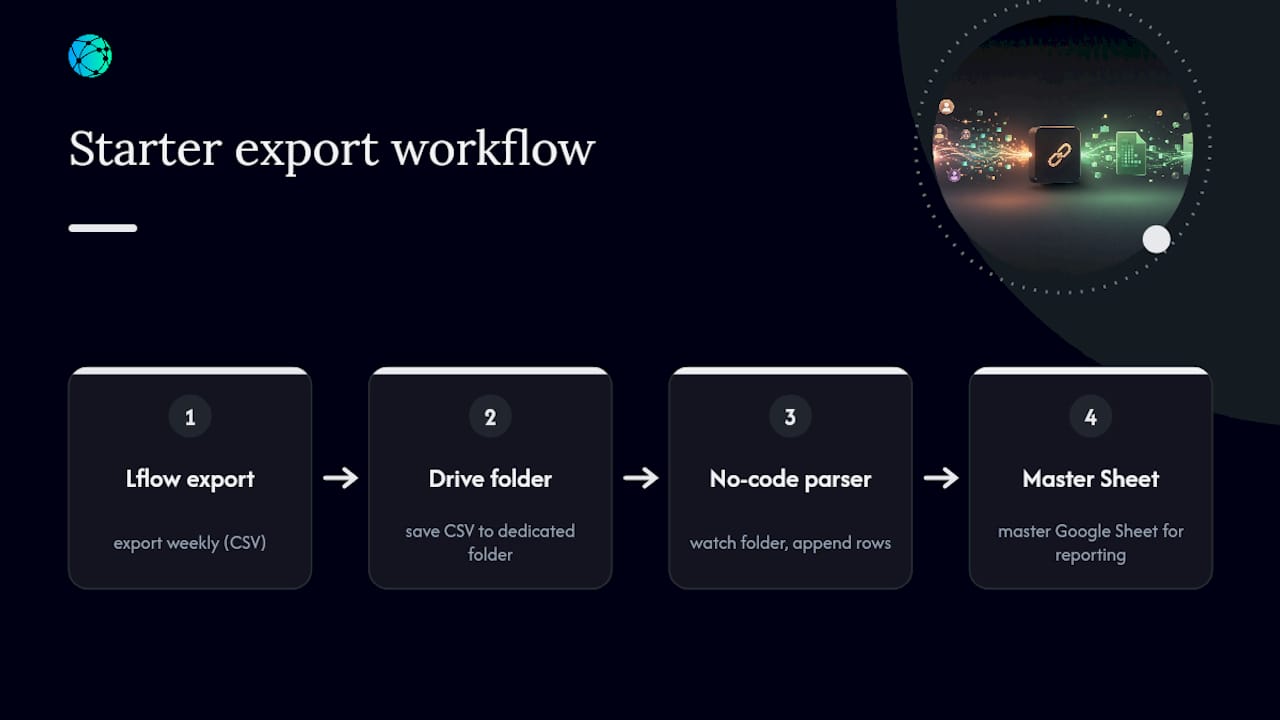
A simple starter workflow: export weekly from Lflow, save the file to a dedicated Drive folder, and let a no-code parser append new rows to your master sheet automatically. It's the same Drive watcher pattern described in Method D, just pointed at your own export. For deeper metric definitions, Lflow's guide to link and QR analytics breaks down which fields matter most for creator reporting.
When to Automate Now vs. Start Manual
Weekly CSV imports are enough until you're reporting to more than two stakeholders or exporting more than a few times a month. Once manual exports eat more than 30 minutes a week, or you need same-day numbers for a live campaign, build the Drive watcher or API sync. Scale in stages: CSV first, then a scheduled add-on, then Apps Script or webhooks once the reporting cadence demands it.
— Axion
Try Lflow's Free Plan for Exportable Click and QR Data
Some platforms offer reporting-ready analytics without touching a line of code. Free plans often include unlimited links, real-time click and scan tracking, and CSV exports with fields suited for immediate import as described in this guide.
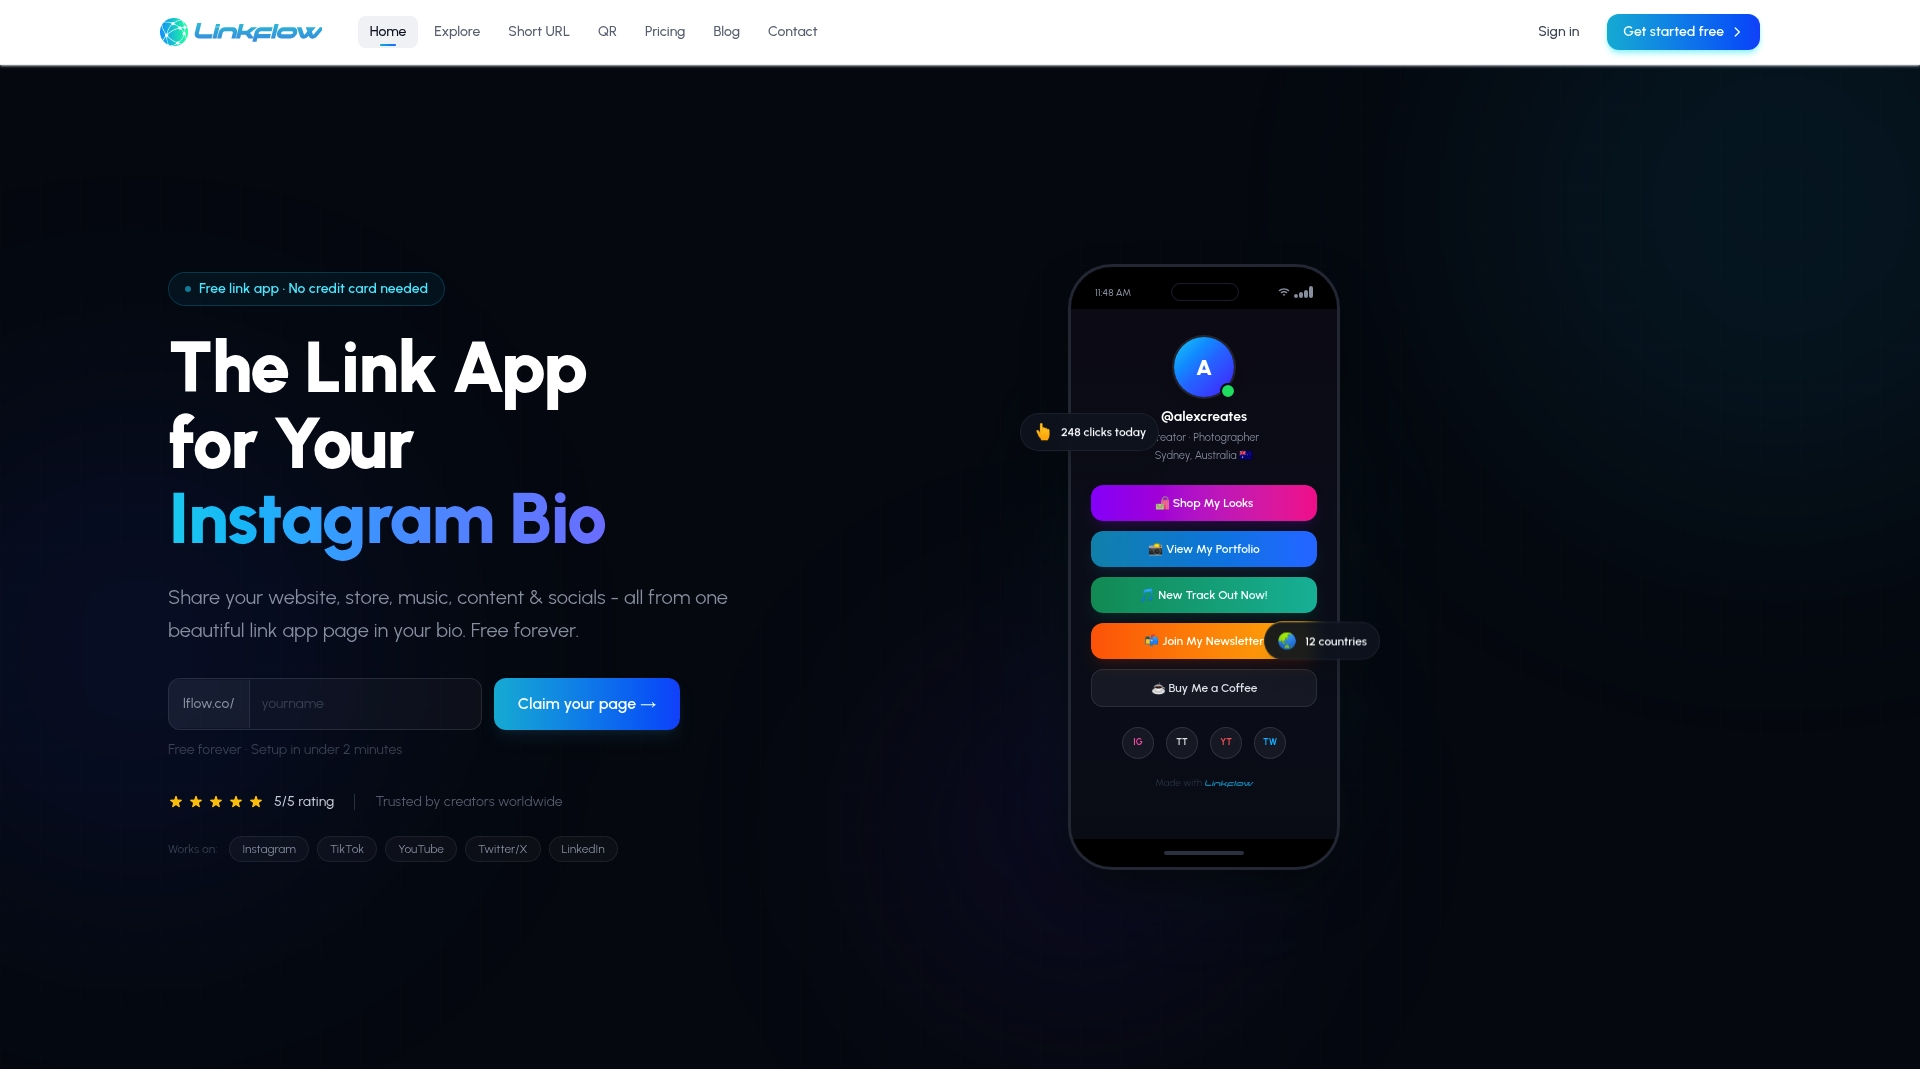
If you're running QR campaigns alongside your bio page, Lflow's QR code generator creates trackable codes for offline promotion, each one feeding scan data straight into the same export. Set up your page, run a campaign for a week, then export the CSV and drop it into the Sheet template from this guide. You'll have a working dashboard before your next posting cycle. Start with the free link-in-bio plan and export your first report today.
Sources
- How to import LinkedIn pages to Google Sheets (Porter Metrics)
- How to import social media statistics into Google Sheets (TheBricks)
- Export data as CSV — Linkly
- How to automate social media reporting with n8n + Google Sheets (triggerAll)
FAQ
What's the fastest way to get analytics into Google Sheets?
Export a CSV from your link-in-bio dashboard and import it through File > Import in Google Sheets. It takes minutes and needs no code or approvals.
Can I automate CSV imports without coding?
Yes. Save exports to a Google Drive folder and use a no-code tool like n8n or Zapier to detect new files and append them to your Sheet automatically.
Does Lflow support CSV exports for analytics?
Lflow's dashboard exports click and QR scan data as CSV, including timestamps, referrers, and UTM fields, ready for the import workflow described above.
What fields should I include in my analytics export?
Include timestamp, link slug, QR scan ID, referrer, UTM parameters, device type, and country. Skip IP addresses and precise geolocation for privacy reasons.
When should I move from CSV to full automation?
Once manual exports take more than 30 minutes a week or you need same-day data for a live campaign, switch to a scheduled add-on or an API-based sync.